1
Brief on biomass for energy in the European Union
123
1
This brief is based on data from the National Renewable Energy Action Plans (NREAPs) and Progress Reports from
Member States (under Article 4 and Article 22 of the Directive 2009/28/EC), as well as from Eurostat energy statistics
(2018a, 2018b).
2
Here "biomass" means the biodegradable fraction of products, waste and residues from biological origin from agriculture,
including vegetal and animal substances, from forestry and related industries, including fisheries and aquaculture, as well
as the biodegradable fraction of waste, including industrial and municipal waste of biological origin as defined in the
Directive of the European Parliament and the Council on the promotion of the use of energy from renewable sources (EU,
2018). Bioenergy is the energy produced from biomass.
3
European Union, comprising of the following 28 Member States (MS): Austria, Belgium, Bulgaria, Croatia, Cyprus,
Czechia, Denmark, Estonia, Finland, France, Germany, Greece, Hungary, Ireland, Italy, Latvia, Lithuania, Luxembourg,
Malta, the Netherlands, Poland, Portugal, Romania, Slovakia, Slovenia, Spain, Sweden, the United Kingdom.
Key messages
1. Biomass
2
for energy (bioenergy) continues to be the main source of renewable energy in
the EU
3
, with a share of almost 60%. The heating and cooling sector is the largest end-
user, using about 75% of all bioenergy (see section 1).
2. Bioenergy contributes to the EU’s energy security, as most of the demand is met from
domestically produced biomass (about 96% in 2016) (see section 2).
3. Forestry is the main source of biomass for energy (logging residues, wood-processing
residues, fuelwood, etc.). Wood pellets, mainly for heating and electricity production,
have become an important energy carrier (see section 3).
4. Germany, France, Italy, Sweden and the UK are the largest bioenergy consumers in
absolute terms, while the Scandinavian and Baltic countries, as well as Austria, consume
the most bioenergy per capita (see section 4).
5. Bioenergy can play a key role in achieving the EU's renewable energy targets for 2030
and beyond. However, biomass for energy must be produced, processed and used in a
sustainable and efficient way in order to optimise greenhouse gas savings and maintain
ecosystem services, all without causing deforestation or degradation of habitats or loss
of biodiversity (see section 5).
2
1. What is the contribution of bioenergy to renewable energy in the EU?
Bioenergy is derived from a wide range of feedstocks, such as biomass from agriculture (crop residues,
bagasse, animal waste, energy crops, etc.), forestry (logging residues, wood processing by-products, black
liquor from the pulp and paper industry, fuelwood, etc.), and other types of biological waste (food waste,
food industry waste, the organic fraction of municipal solid waste, etc.). Bioenergy continues to be the main
source of renewable energy in the EU in terms of gross final consumption
4
, notwithstanding the rapid growth
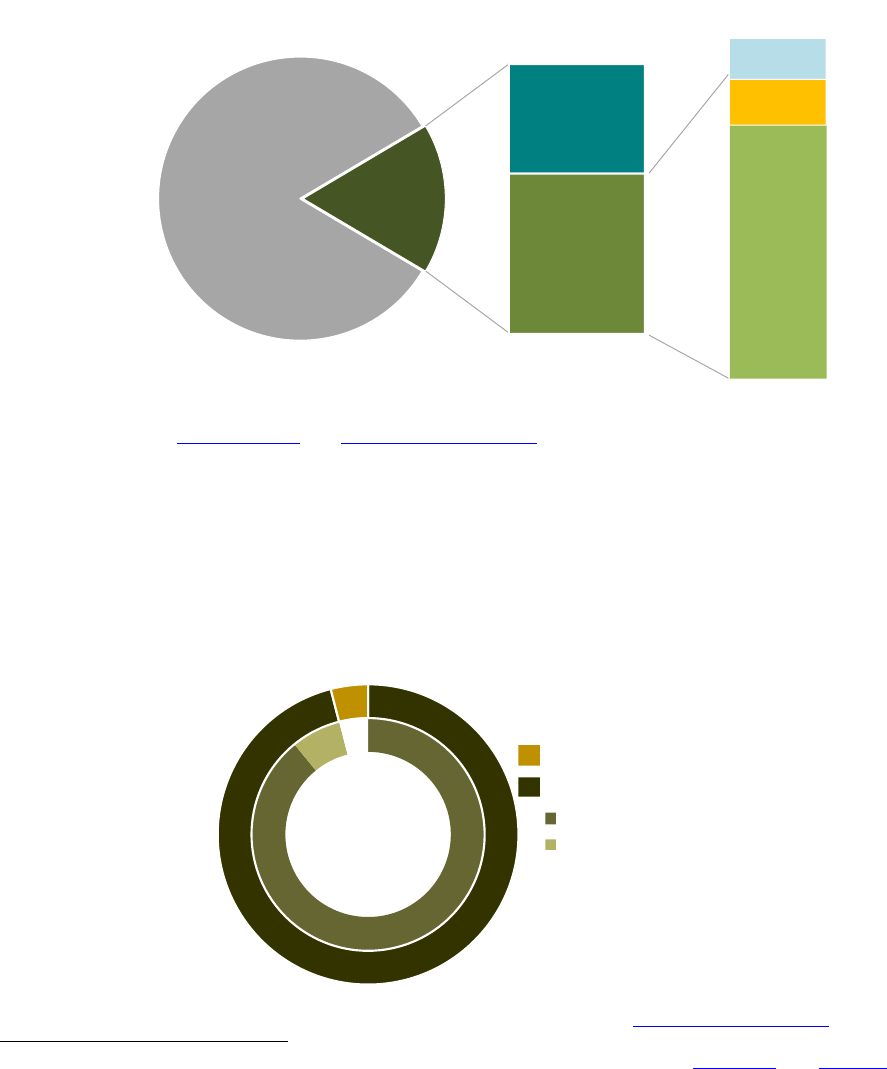
of wind and solar power over the past decade. Bioenergy (heat, electricity and transport fuels) contributed
116 Mtoe (59% of all renewables and 10% of all energy sources, see Figure 1) to the gross final energy
consumption in 2016. In terms of end use, the largest sector is heating and cooling (H&C), which accounts
for about 75% of all bioenergy consumed. Bioelectricity and transport biofuels account for 13% and 12%
respectively.
Figure 1. Share of renewables in the EU's gross final energy consumption for 2016 and breakdown of the bioenergy
contribution. Source: Eurostat 2018b and NREAP Progress Reports.
2. Where is biomass used for bioenergy production in the EU sourced from?
Biomass supply for bioenergy (i.e. primary energy) in the EU reached 140 Mtoe in 2016. Of this, 96% was
sourced from within the EU and the remaining 4% was imported from non-EU countries. EU-sourced
biomass is mostly transformed into energy in the Member State in which it is produced, with only 7.2%
being converted into energy in a different Member State (see Figure 2).
Figure 2. Origin of biomass supplied for energy in 2016 in the EU-28. Source: NREAP Progress Reports.
4
Gross final consumption of energy, as defined in Article 2 of Directive 2009/28/EC (EC 2009) and EC 2018, means: the
energy commodities delivered for energy purposes to industry, transport, households, services including public services,
agriculture, forestry and fisheries; the consumption of electricity and heat by the energy branch for electricity; heat and
transport fuel production; and losses of electricity and heat in distribution and transmission.
Non-renewables
951 941 ktoe
(83%)
Other
renew ables
79 782 ktoe
(40.8%)
Bioenergy
115 694 ktoe
(59.2%)
Renewable
energies
195 476 ktoe
(17%)
Biomass
H&C
74.6%
Bioelectricity
13.4%
Transport
biofuels
12.0%
92.8%
7.2%
96%
4%
Biomass
for energy
(140 Mtoe)
Imported into EU
Produced in the EU
Transformed in source MS
Transformed in different MS
3
While the data on imports only covers direct trade of biomass for energy, additional biomass feedstock may
come through indirect trade, such as starch and oil crops for food and feed that could be partially used for
biofuels. In addition, some by-products from the processing of imported roundwood or wood chips are used
for bioenergy generation. The quantification of indirect trade is complex and depends on the end uses, the
conversion efficiency of raw materials, the production processes, etc.
3. Which sources contribute most to the supply of biomass for energy?
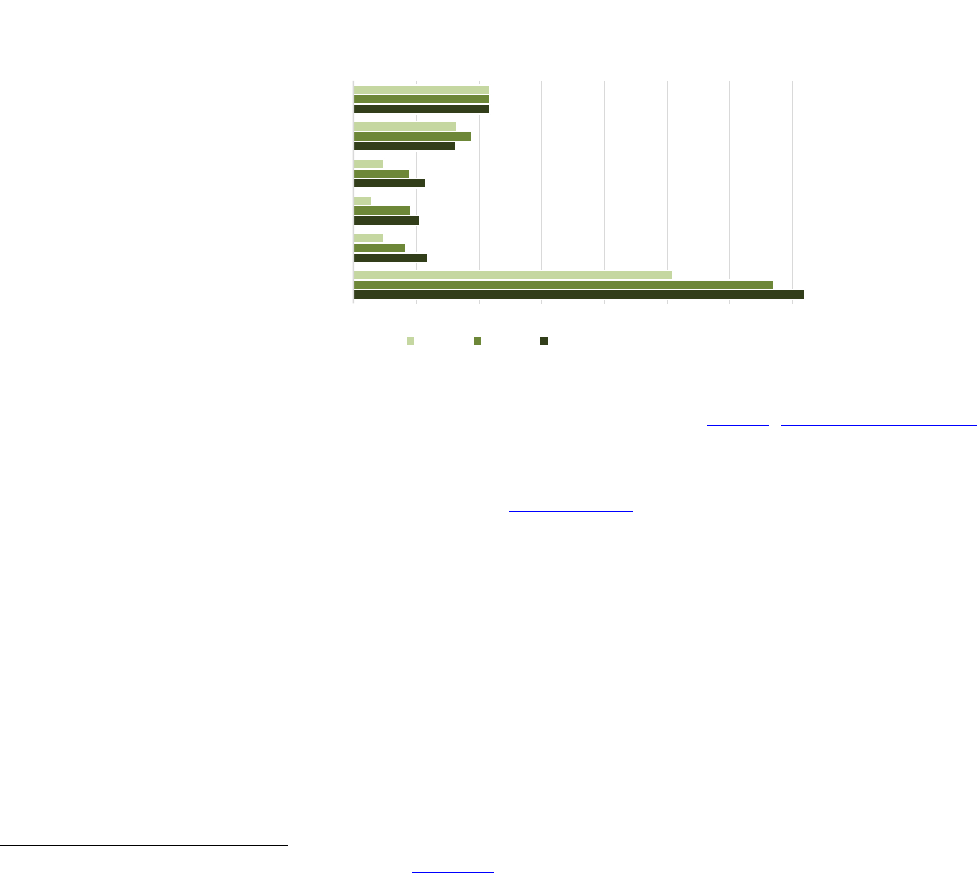
Forestry accounts for more than 60% of all EU domestic biomass supplied for energy purposes: in 2016,
direct supply of woody biomass from forests and other wooded land contributed 32.5% (44 Mtoe), and
indirect supply of wood contributed another 28.2% (38 Mtoe) (see Figure 3)
5
. Almost 27% (36 Mtoe)
originated from agricultural biomass (equally from agricultural crops and agricultural by-products), with
waste (municipal, industrial, etc.) making up the remaining 12.4% (17 Mtoe). In 2016, the share sourced
from forestry was already higher than that foreseen in the NREAP projections for 2020, while the share from
agricultural by-products and waste lagged behind the 2020 projections.
Figure 3. Domestic biomass supplied for energy in 2006, 2016 (EU country data) and initial projections for 2020
(according to the projections in the National Renewable Energy Action Plans)
5
. Source: NREAPs, NREAP Progress Reports.
Wood is the most important single source of energy from renewables in many Member States. Latvia (29%),
Finland (24%), Sweden (20%), Lithuania (17%) and Denmark (15%) had the largest share of wood and
wood products in gross inland consumption of energy
8
(Eurostat 2018a). A large proportion of solid biomass is
used directly by households and other final consumers (industries, services, agriculture/forestry). The use of
fuelwood in households is particularly important in France, Italy, Germany, Romania and Poland.
Wood pellets have become an important energy carrier traded on a large scale and over long distances, due
to their high energy density
6
and stable characteristics. Global production reached 29 million tonnes in 2016,
of which more than 50% was produced in the EU. The EU is also the main consumer globally (23 million
tonnes, of which 32.6% is consumed in the UK, 9.1% in Italy, 8.7% in Germany, 8.7% in Denmark and
7.4% in Sweden). In some Member States, the consumption of wood pellets relies mostly on imports, e.g.
the UK (94.7%) and Italy (81%). Wood pellets are mostly used in the residential sector for heating (in Italy,
Austria, etc.) or for electricity production (in the UK, Austria, etc.).
5
According to Commission Decision C(2009) 5174 (EC 2009):
- Direct supply of woody biomass from forests and other wooded land for energy generation includes: fellings, residues
from fellings (tops, branches, bark, stumps) or landscape management residues (woody biomass from parks,
gardens, tree rows, bushes).
- Indirect supply of woody biomass includes: residues from sawmilling, woodworking, furniture industry (bark,
sawdust), by-products of the pulp and paper industry (black liquor, tall oil) or processed fuelwood, post-consumer
recycled wood (recycled wood for energy generation, household waste wood).
6
Wood pellets have a Lower Heating Value of 17.5 GJ/tonne on average (1 tonne=0.418 toe)
0 20 40 60 80 100 120 140
Total
Waste
Agricultural by-products
Agricultural crops
Indirect wood supply
Direct wood supply
Domestic EU Primary Energy Supply (Mtoe)
2006 2016 2020
4
Agricultural crops represented the largest source of feedstock for biofuel production (72% of about 14 Mtoe
used in transport in 2016
7
), with various waste products and residues contributing to the remainder (28%).
Most of the biofuels were produced from domestic feedstock, with less than 7% imported in 2016,
confirming a trend towards fewer imports over the past few years.
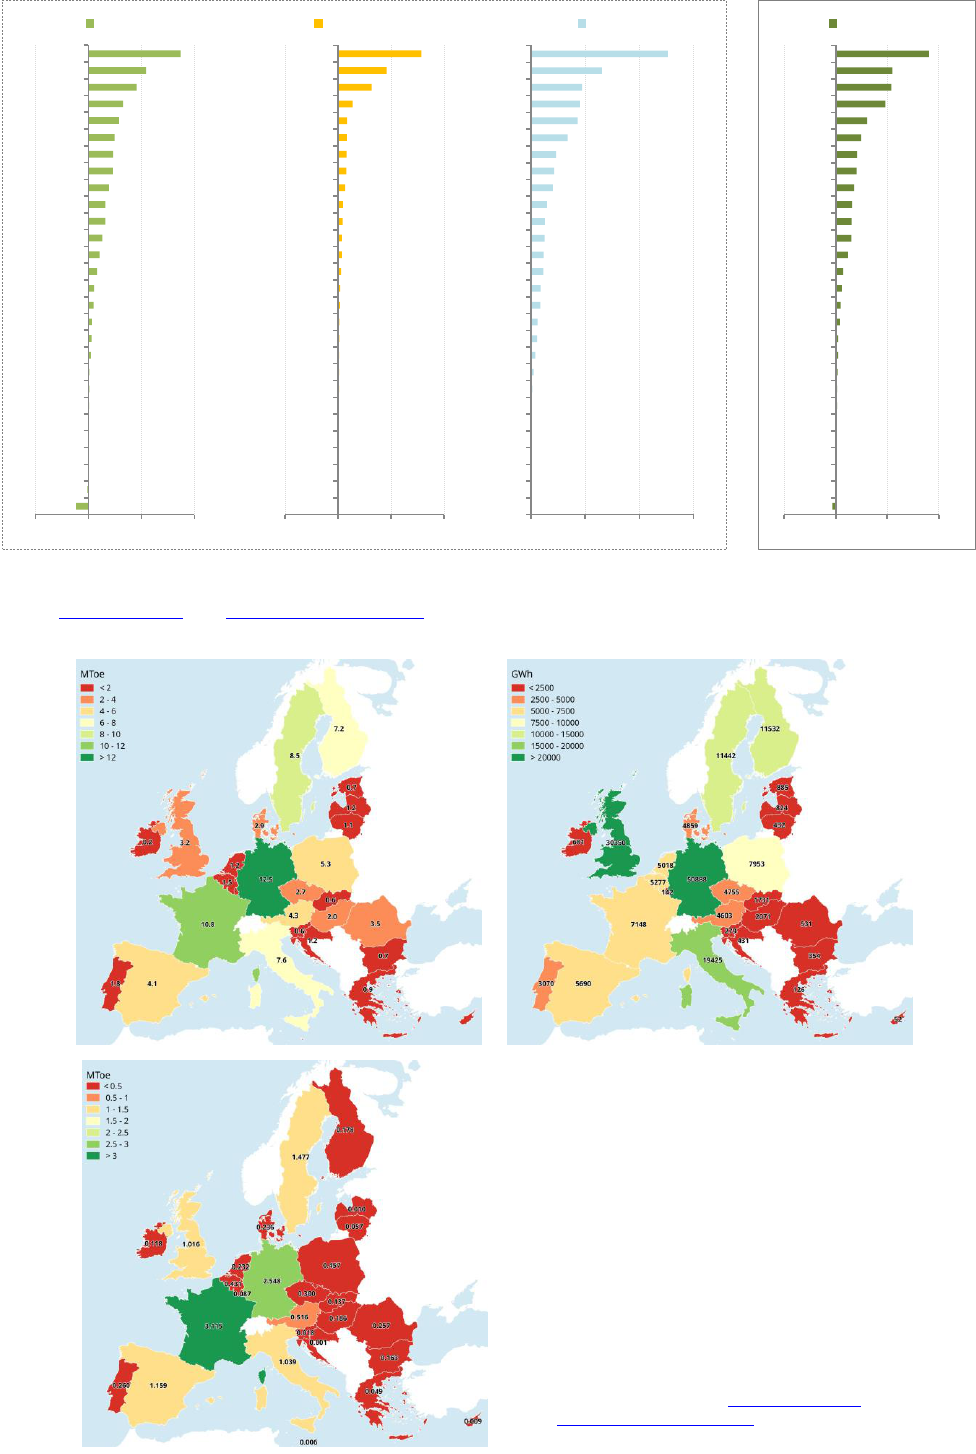
4. Who are the largest consumers of bioenergy?
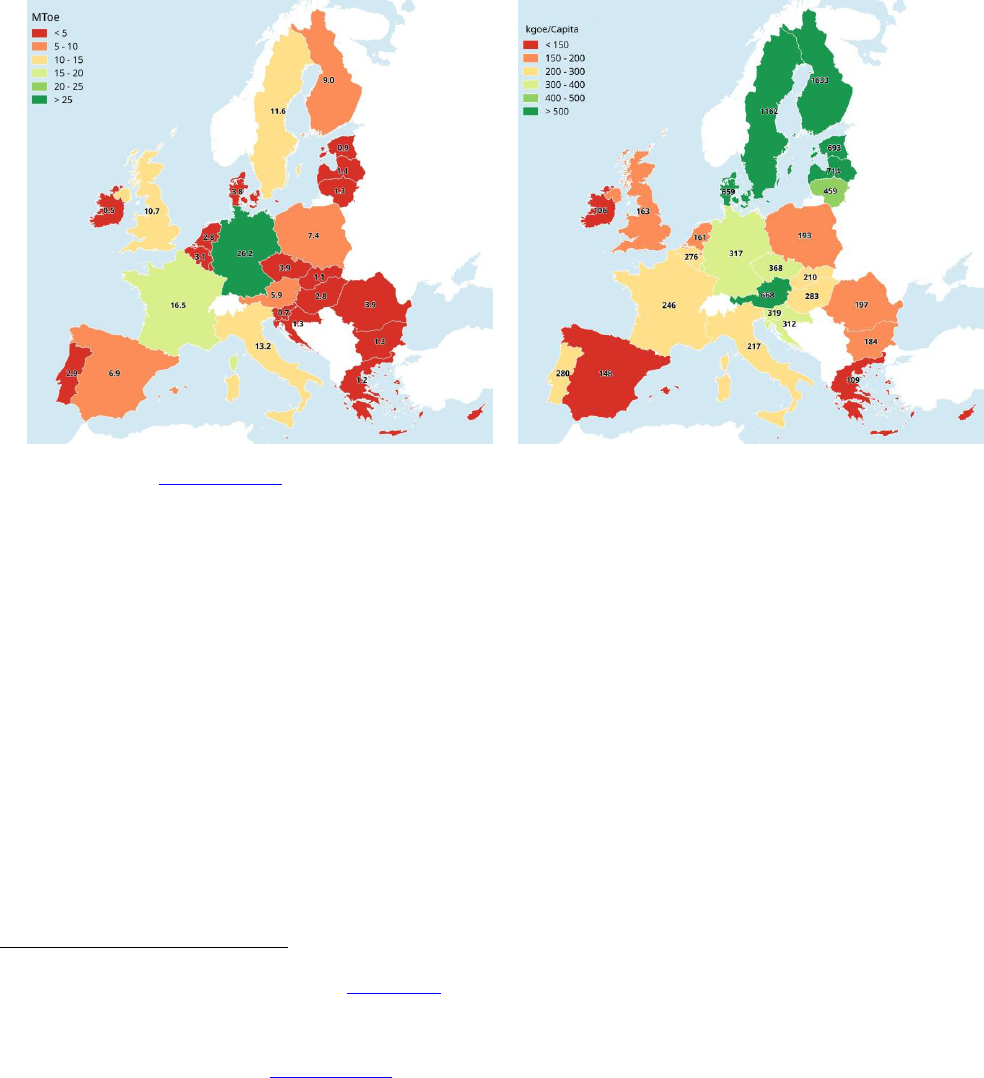
Germany, France, Italy, Sweden and the UK are the top five EU Member States as regards gross inland
consumption
8
of bioenergy according to 2016 data, considering both domestic production and imports of the
bioenergy carriers (Figure 4a). Those countries also experienced the highest levels of growth in bioenergy
consumption over the period 2005-2016 (Figure 5). During that period, bioenergy consumption in the EU
increased by more than 60%. On the other hand, the Scandinavian and Baltic countries, as well as Austria,
are the largest consumers on a per-capita basis (Figure 4b).
a) b)
Figure 4. Gross inland bioenergy consumption
8
in EU Member States in 2016: total in Mtoe (a) and per capita in kgoe/per
capita (b). Source: Eurostat 2018a
Within the bioenergy sector, bioelectricity has experienced the most significant relative growth over this
period (about 160% increase at EU level) as a result of various support schemes. In 2016, Germany, the
UK, Italy, Finland and Sweden were the largest bioelectricity consumers, and Germany, France, Sweden,
Italy and Finland the largest consumers of bioheat (Figure 6). The biofuels for the transport sector are
mainly consumed in France, Germany, Sweden, Spain, Italy and the UK, with a large gap between their
consumption and that of the rest of the Member States.
7
This figure includes only compliant biofuels - as of 2011 those in compliance with the sustainability requirements of
Articles 17 and 18 of Directive 2009/28/EC (EU, 2009).
8
Gross inland energy consumption represents the quantity of energy necessary to satisfy inland consumption and covers
the consumption by the energy sector itself, the distribution and transformation losses, and the final energy consumption
by end users. It is defined as primary production plus imports, recovered products and stock changes, minus exports and
fuel supply to maritime bunkers (Eurostat 2018c).
5
Figure 5. Variation in gross final bioenergy consumption (ktoe)
4
in EU Member States between 2005 and 2016.
Source: Eurostat 2018a and NREAP Progress Reports. Note: Biofuels data includes only those biofuels that are compliant
with sustainability criteria, as provided by the Renewable Energy Directive
7
.
a) b)
c)
-3 000 0 3 000 6 000
DE
IT
UK
FR
FI
PL
SE
AT
DK
HU
CZ
BE
ES
NL
LT
RO
SK
EE
SI
IE
EL
LV
LU
CY
MT
BG
HR
PT
Bioheat
-2 000 0 2 000 4 000
DE
UK
IT
PL
CZ
SE
FR
BE
ES
AT
FI
SK
DK
PT
EE
LV
IE
RO
LT
HR
HU
BG
SI
EL
LU
CY
MT
NL
Bioelectricity
0 1 000 2 000 3 000
FR
SE
UK
ES
IT
DE
AT
BE
PL
CZ
PT
RO
DK
NL
HU
FI
SK
IE
LU
LT
EL
SI
CY
LV
MT
HR
BG
EE
Biofuels
-5 000 0 5 000 10 000
DE
UK
IT
FR
SE
PL
FI
AT
ES
CZ
BE
DK
HU
NL
RO
SK
LT
EE
IE
SI
LU
LV
EL
CY
BG
MT
HR
PT
Bioenergy
Figure 6. Gross final consumption of
bioheat (a), bioelectricity (b), and
transport biofuels (c) in EU Member States
in 2016. Source: Eurostat 2018b and
NREAP Progress Reports.
+
+
→
Variation in gross final bioenergy consumption (2005-2016 ktoe)
6
5. What role can bioenergy play in the future?
Bioenergy plays an important role in helping to meet the EU's 2020 target of 20% renewable energy. Under
the 2010 National Renewable Energy Action Plans, total biomass demand for electricity, heating and
transport is planned to reach 178 Mtoe by 2020. As seen in Section 2, by 2016 the biomass supply for
energy had reached 140 Mtoe. However, growth has been slower than foreseen. The domestically sourced
biomass supply (almost 135 Mtoe, see Figure 3) will need to increase by 7.4% to reach the planned 2020
level. While the share from the forestry sector is above the expected level (already 81 Mtoe in comparison to
the 76 Mtoe level expected for 2020), the supply from agricultural crops would need to increase by 29% and
from agricultural by-products by 17%. However, the largest relative increase is needed in bioenergy from
waste, where 42% growth would be required to reach 23.7 Mtoe by 2020.
Looking further ahead, the EU has recently adopted a 32% target for renewables in total gross final energy
consumption by 2030. Overall, the bioenergy sector has grown substantially and the 2016 data shows good
progress towards the 2030 target. In line with the trend noted above for biomass (i.e. primary energy
supply), the EU's gross inland bioenergy consumption increased by more than 69% during the period 2005-
2016, but this growth rate has fallen since 2010 (from an average annual growth rate of 7.9% in 2005-2010
to 2.6% in the period 2011-2016).
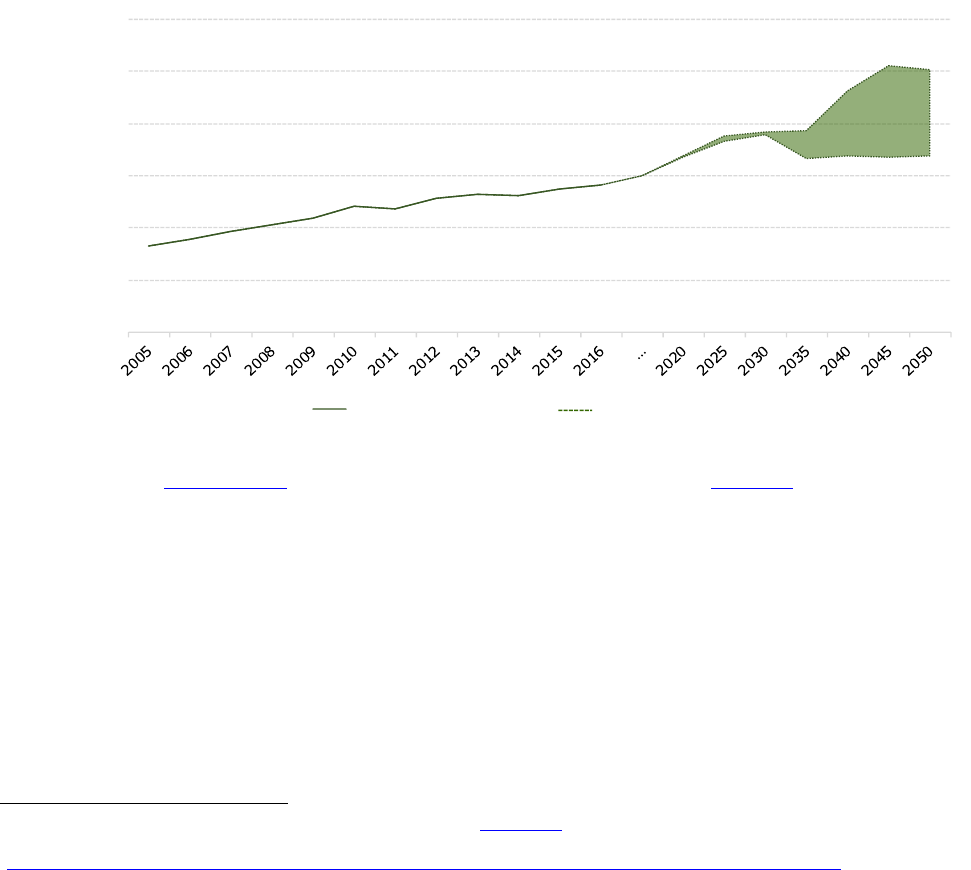
The Commission's long-term vision for a prosperous, modern, competitive and climate-neutral economy
estimates that, by 2050, the gross inland consumption of bioenergy will amount to between 170 and 252
Mtoe (depending on the scenario). Figure 7 combines the 2005-2016 reported data for bioenergy and
projections of bioenergy consumption, based on eight scenarios for mitigation options
9
.
Figure 7. Gross inland bioenergy consumption during the period 2005-2016 and projections until 2050 based on mitigation
scenarios. Sources: Eurostat 2018b and In-depth analysis of the European Commission (EC 2018)
9
.
There are significant opportunities for developing the use of agricultural residues and by-products, as well as
waste. Biogas production is based on the use of various waste products and residues, landfill gas and energy
crops (energy grasses, silage maize, etc.). The EU is the world leader in biogas electricity production (more
than 10 GW and 17 400 biogas plants installed in 2015) as well as in biomethane production for use as a
vehicle fuel or for injection into the natural gas grid (459 plants producing 1.2 billion m
3
) (Scarlat et al.,
2018). Perennial energy grasses and short rotation coppices cultivated in a sustainable manner can play an
important role as feedstock for gasification and pyrolysis in the production of biogas and biofuels. They
represent one of the few alternatives for decarbonising the air transport, road freight and maritime sectors
as well as for replacing fossil fuel methane in the gas grid.
Furthermore, the use of bioenergy combined with carbon capture and storage (CCS)
10
represents a
promising negative emissions technology, especially in bioenergy installations with large and highly
9
See the in-depth analysis accompanying COM(2018) 773 (EC 2018). A Clean Planet for all. A European long-term
strategic vision for a prosperous, modern, competitive and climate neutral economy
(https://ec.europa.eu/clima/sites/clima/files/docs/pages/com_2018_733_analysis_in_support_en_0.pdf).
0
50
100
150
200
250
300
Gross inland bioenergy consumption
(Mtoe)
Eurostat statistics
Modelling
divergence
Projections

7
concentrated CO
2
flue gases (to overcome the high capital costs of CO
2
capture). However, its role will
depend on its ability to supply large amounts of biomass in a sustainable way and the development of CCS
technologies.
Bioenergy can also play a significant role as a flexible producer, balancing the power system and allowing for
higher shares of variable renewable energy sources, such as solar and wind, in the electricity grid.
Integrated bioenergy hybrids that combine bioenergy with solar thermal, concentrated solar power, heat
pumps and waste heat recovery can ensure flexible options for both energy (heat and power) supply and
energy storage.
The key condition for bioenergy development is the availability of reliable, affordable and sustainable
biomass
11
. Biomass production and use involves a chain of activities ranging from the growing and
harvesting of feedstocks, processing, conversion and distribution of bioenergy carriers to final energy use.
Each step can pose different sustainability challenges that need to be managed. The environmental
performance of a bioenergy source depends on the specific characteristics of those steps in the value chain
and should therefore be assessed on a case-by-case basis.
If well managed, bioenergy pathways can deliver significant greenhouse gas savings, whilst ensuring food
security and protecting ecosystems and the services they provide from deforestation, degradation of
habitats and loss of biodiversity
12
. Bioenergy production can also bring significant opportunities to deliver
social, environmental and economic benefits and contribute to rural development. Possible alternative uses
of biomass (e.g. for food, feed, wood products, etc.) also need to be considered to ensure the sustainability
of feedstock supply from an overall bioeconomy perspective.
Cascading the use of biomass could improve resource efficiency and limit pressure on natural resources;
indeed, resource efficiency can be a basis for differentiating between different biomass pathways. Within an
interlinked bioeconomy, the approach to biomass production for food and feed, bioenergy and other
purposes should evolve from single end-use orientation to integrated production systems (IEA Bioenergy,
IRENA and FAO, 2017).
10
Through CCS, the carbon that is taken up during plant growth and transformed into CO
2
during energy conversion is
captured from large point sources (e.g. power plants and industrial installations) for geological storage in suitable sites
underground (including oil and gas reservoirs, unmineable coal seams, and deep saline reservoirs).
11
Article 29 of the EU 2018 includes specific sustainability and greenhouse gas emissions savings criteria for biofuels,
bioliquids and biomass fuels.
12
Ecosystem services are the direct and indirect contribution of ecosystems to human well-being, such as climate
regulation, water purification, pest and disease control, soil diversity maintenance and cultural services provision
(https://biodiversity.europa.eu/topics/ecosystem-services).
Knowledge gaps
1. More detailed statistics are needed on the use of biomass from agriculture, forestry and
waste for energy purposes (e.g. energy crops, agricultural and industrial residues and by-
products, biowaste, wood waste, sewage sludge, etc.).
2. Differences in reporting (e.g. biomass supply or energy consumption, volumes or energy
units) hinder the comparison and equivalent breakdown of the biomass feedstock used
and bioenergy production.
3. Scarce and/or incomplete data on biomass trade for energy use needs to be addressed.
4. Comprehensive assessments are required of the benefits and impacts on the environment
and socio-economic pillars (greenhouse gas emissions, biodiversity and ecosystem
services), including through natural capital accounting.
5. Future research should develop methodologies for prioritising the bioenergy pathways that
can bring significant greenhouse gas emission reductions in relation to fossil fuel use in
biomass production, transport and conversion, as well as efficiencies of conversion, etc.

This brief has been prepared by the Joint Research Centre (JRC) for the European Commission's Knowledge
Centre for Bioeconomy, which brings together knowledge and scientific evidence from within and outside of
the European Commission in a transparent, tailored and concise manner, to inform policymaking on the
bioeconomy. The scientific output expressed does not imply a policy position of the European Commission.
Neither the European Commission nor any person acting on behalf of the Commission is responsible for the
use that might be made of this publication.
European Commission's Knowledge Centre for Bioeconomy
https://ec.europa.eu/knowledge4policy/bioeconomy
Contact: EC[email protected] doi:10.2760/546943
ISBN 978-92-79-77235-1
JRC109354
© European Union, 2019
Reproduction is authorised provided that the source is acknowledged, save where otherwise stated.
KJ
-
07
-
17
-
187
-
EN
-
N
References
EC 2009, Commission Decision No. C(2009) 5174 of 30 June 2009 establishing a template for National Renewable Energy
Action Plans under Directive 2009/28/EC. Available at: https://eur-lex.europa.eu/legal-
content/EN/TXT/?uri=CELEX%3A32009D0548. Accessed: 25 Sep 2018
EC 2018, A Clean Planet for all. A European long-term strategic vision for a prosperous, modern, competitive and climate
neutral economy. COM(2018) 773. Available at: https://ec.europa.eu/clima/policies/strategies/2050_en. Accessed: 29
Nov 2018.
EU 2009, Directive 2009/28/EC of the European Parliament and of the Council of 23 April 2009 on the promotion of the
use of energy from renewable sources and amending and subsequently repealing Directives 2001/77/EC and 2003/30/EC.
Available at: https://eur-lex.europa.eu/legal-content/EN/ALL/?uri=celex%3A32009L0028. Accessed: 25 Sep 2018.
EU 2018, Directive (EU) 2018/2001 of the European Parliament and of the Council of 11 December 2018 on the promotion
of the use of energy from renewable sources. Available at: https://eur-lex.europa.eu/legal-
content/EN/TXT/?toc=OJ%3AL%3A2018%3A328%3ATOC&uri=uriserv%3AOJ.L_.2018.328.01.0082.01.ENG. Accessed:
11 December 2018.
IEA Bioenergy, IRENA and FAO, 2017. Bioenergy for Sustainable Development (Paris: 2017). Available at:
https://www.ieabioenergy.com/publications/bioenergy-for-sustainable-development/. Accessed: 03 Oct 2018.
National Renewable Energy Action Plans (NREAPs). Available at: https://ec.europa.eu/energy/en/topics/renewable-
energy/national-action-plans. Accessed: 25 Sep 2018
National Renewable Energy Action Plans Progress Reports (NREAPs Progress reports) from Member States under Article 22
of Directive 2009/28/EC on the promotion of the use of energy from renewable sources. Available at:
http://ec.europa.eu/energy/en/topics/renewable-energy/progress-reports. Accessed: 25 Sep 2018
Scarlat, N., Dallemand, J-F., Fahl, F. 2018. Biogas: Developments and perspectives in Europe. Renewable Energy 129:
457-472. https://doi.org/10.1016/j.renene.2018.03.006.
Web-based references
Eurostat 2018a. Energy balances. Available at: https://ec.europa.eu/eurostat/web/energy/data/energy-balances.
Accessed: 25 Sep 2018.
Eurostat 2018b. Share of energy from renewable sources. Available at:
http://ec.europa.eu/eurostat/web/energy/data/shares. Accessed: 25 Sep 2018.
Eurostat, 2018c. Glossary. Available at: https://ec.europa.eu/eurostat/statistics-
explained/index.php?title=Category:Glossary. Accessed: 25 Sep 2018.
