
EN EN
EUROPEAN
COMMISSION
Brussels, 14.10.2020
COM(2020) 953 final
REPORT FROM THE COMMISSION TO THE EUROPEAN PARLIAMENT AND
THE COUNCIL
on progress of clean energy competitiveness
{SWD(2020) 953 final}
1
CONTENTS
1. INTRODUCTION ....................................................................................................... 2
2. OVERALL COMPETITIVENESS OF THE EU CLEAN ENERGY
SECTOR ...................................................................................................................... 4
2.1 Energy and resource trends ................................................................................... 4
2.2 Share of EU energy sector in EU GDP ................................................................. 6
2.3 Human capital ........................................................................................................ 6
2.4 Research and innovation trends ............................................................................. 9
2.5 Covid-19 Recovery .............................................................................................. 11
3. FOCUS ON KEY CLEAN ENERGY TECHNOLOGIES AND
SOLUTIONS ............................................................................................................. 12
3.1 Offshore renewables – wind ................................................................................ 12
3.2 Offshore renewables – Ocean energy .................................................................. 16
3.3 Solar photovoltaics (PV) ..................................................................................... 18
3.4 Renewable hydrogen production through electrolysis ........................................ 20
3.5 Batteries ............................................................................................................... 23
3.6 Smart electricity grids ......................................................................................... 26
3.7 Further findings on other clean and low carbon energy technologies and
solutions ........................................................................................................... 30
CONCLUSIONS ............................................................................................................... 31

2
1. INTRODUCTION
The goal of the European Green Deal
1
, Europe’s new growth strategy, is to transform the
European Union (EU)
2
into a modern, resource-efficient and competitive economy,
which is climate neutral by 2050. The EU’s economy will need to become sustainable,
while making the transition just and inclusive for everyone. The Commission’s recent
proposal
3
to cut greenhouse gas emissions by at least 55% by 2030 sets Europe on that
responsible path. Today, energy production and use account for more than 75% of the
EU’s greenhouse gas emissions. The delivery of the EU’s climate goals will require us to
rethink our policies for clean energy supply across the economy. For the energy system,
this means a steep decarbonisation and an integrated energy system largely based on
renewable energy. By 2030 already, the EU renewable electricity production is set to at
least double from today’s levels of 32% to around 65% or more
4
and by 2050, more than
80% of electricity will be coming from renewable energy sources
5
.
Achieving these 2030 and 2050 targets requires a major transformation of the energy
system. This however depends heavily on uptake of new clean technologies and
increased investments in the needed solutions and infrastructure. However, as well as the
business models, skills, and changes in behaviour to develop and use them. Industry lies
at the heart of this social and economic change. The New Industrial Strategy for Europe
6
gives European industry a central role in the twin green and digital transitions.
Considering the EU’s large domestic market, accelerating the transition will help
modernise the whole EU economy and increasing the opportunities for the EU’s global
clean technologies leadership.
This first annual progress report on competitiveness
7
aims to assess the state of the clean
energy technologies and the EU clean energy industry’s competitiveness to see if their
development is on track to deliver the green transition and the EU’s long-term climate
goals. This competitiveness assessment is also particularly crucial for the economic
recovery from the COVID-19 pandemic, as outlined in the ‘Next Generation EU’
communication
8
. Improved competitiveness has the potential to mitigate the short- and
medium-term economic and social impact of the crisis, while also addressing the longer-
term challenge of the green and digital transitions in a socially fair manner. Both in the
context of the crisis, but also in the long run, improved competitiveness can address
energy poverty concerns, reducing the cost of energy production and the cost of energy
efficiency investments
9
.
It is possible to ascertain the clean energy technology needs for achieving the 2030 and
2050 targets on the basis of the impact assessment referred to in the European
1
COM(2019) 640 final.
2
For the purpose of this report, EU is to be understood as EU27 (i.e. without the UK). Whenever the UK is included,
this report will refer to EU28.
3
COM(2020) 562 final.
4
COM(2020) 562 final.
5
COM/2018/773 final.
6
COM (2020) 102 final.
7
Drawn up in accordance with the requirements of Article 35 (m) of Regulation (EU) 2018/1999
(Governance Regulation)
8
COM(2020) 456 final
9
See also A Renovation Wave for Europe – greening our buildings, creating jobs, improving lives COM(2020)662
accompanied by SWD(2020)550, and Energy Poverty Recommendation C(2020)9600

3
Commission’s Climate Target Plan scenarios
10
. In particular, the EU is expected to invest
in renewable electricity, notably offshore energy (in particular wind) and solar
energy
11
,
12
. This large increase in the share of variable renewables also implies an
increase in storage
13
and in the ability to use electricity in transport and industry,
especially through batteries and hydrogen, and requires major investments in smart grid
technologies
14
. On this basis, the present report focuses on the six technologies
mentioned above
15
, most of which are at the heart of the EU flagship initiatives
16
,
17
aimed
at fostering reforms and investments to support a robust recovery based on twin green
and digital transition. The remaining clean and low-carbon energy technologies included
in the scenarios are analysed in the staff working document with the title ‘Clean Energy
Transition – Technologies and Innovations Report’ (CETTIR) that accompanies this
report
18
.
For the purpose of this report, competitiveness in the clean energy sector
19
is defined as
the capacity to produce and use affordable, reliable and accessible clean energy through
clean energy technologies, and compete in energy technology markets, with the overall
aim of bringing benefits to the EU economy and people.
Competitiveness cannot be captured by a single indicator
20
. Therefore, this report
proposes a set of widely accepted indicators that may be used for this purpose (see table
1 below) capturing the entire energy system (generation, transmission and consumption)
and analysed at three levels (technology, value chain and global market).
10
At time horizon 2050, the 1.5 TECH from the EU 2050 Long Term Strategy (COM (2018) 773) and the Climate
Target plan (COM(2020) 562 final) scenarios display no significant differences and are therefore both referred to
in this report. The CTP MIX scenario achieves around 55% GHG reductions, both expanding carbon pricing and
moderately increasing the ambition of policies.
11
ASSET Study commissioned by DG ENERGY - Energy Outlook Analysis (Draft, 2020) covering LTS 1.5 Life and
Tech, BNEF NEO, GP ER, IEA SDS, IRENA GET TES, JRC GECO 2C_M
12
Tsiropoulos I., Nijs W., Tarvydas D., Ruiz Castello P., Towards net-zero emissions in the EU energy system by 2050
– Insights from scenarios in line with the 2030 and 2050 ambitions of the European Green Deal, JRC118592
13
Study on energy storage - Contribution to the security of the electricity supply in Europe (2020): :
https://op.europa.eu/en/publication-detail/-/publication/a6eba083-932e-11ea-aac4-01aa75ed71a1
14
Between EUR 71 and 110 billion/year of power grid investments between 2031 and 2050 under the different
scenarios, ‘In-depth analysis in support of COM(2018) 773’, table 10, p. 202.
15
Offshore renewables (wind and ocean), solar photovoltaics, renewable hydrogen, batteries and grid technologies.
This selection does not neglect the role of established renewables, in particular bioenergy and hydropower, within
the EU portfolio of low-carbon energy technologies. These are covered in the CETTIR and may be covered in
forthcoming annual reports on progress in competitiveness.
16
European flagship initiatives have been presented in the latest Annual Sustainable Growth Strategy 2021
(COM(2020) 575 final) – section iv.
17
Recent and upcoming initiatives include the upcoming offshore energy strategy and the hydrogen strategy
(COM(2020) 301 final), including the Hydrogen Alliance, the European Batteries Alliance, and the energy system
integration strategy (COM(2020) 299 final). These technologies are also described in a range of national energy
and climate plans.
18
SWD(2020)953 – This includes buildings (incl. heating and cooling); CCS; citizens and communities engagement;
geothermal; high voltage direct current and power electronics; hydropower; industrial heat recovery; nuclear;
onshore wind; renewable fuels; smart cities and communities; smart grids – digital infrastructure; solar thermal
power.
19
In this report and in the SWD, clean energy is considered as all energy technologies included in the EU Long-Term
Strategy to achieve climate neutrality in 2050.
20
Based on the conclusions of the Competitiveness Council (28.07.20).

4
Table 1 Grid of indicators to monitor progress in competitiveness
Competitiveness of EU clean energy industry
1. Technology analysis
Current situation and
outlook
2. Value chain analysis of the
energy technology sector
3. Global market analysis
Capacity installed,
generation
(today and in 2050)
Turnover
Trade (imports, exports)
Cost / Levelised cost of
energy (LCoE)
(today and in 2050)
Gross value added growth
Annual, % change
Global market leaders vs. EU
market leaders
(market share)
Public R&I funding
Number of companies in the
supply chain, incl. EU market
leaders
Resource efficiency and
dependence
Private R&I funding
Employment
Real Unit Energy Cost
Patenting trends
Energy intensity / labour
productivity
Level of scientific
Publications
Community Production
21
Annual production values
Analysis of competitiveness of the clean energy sector can be further developed and
deepened over time, and future competitiveness reports may focus on different angles.
For example by looking in more detail at policies and instruments to support R&I and
competitiveness at the Member State level, how these contribute to the Energy Union and
the Green Deal objectives, looking at competitiveness at subsector
22
, national or regional
level, or by analysing the synergies and trade-offs with environmental or social impacts,
in line with the European Green Deal objectives.
Given the lack of data for a wide range of competitiveness indicators
23
,
24
, some
approximations of a more indirect nature are used (e.g. the level of investment). The
Commission calls on Member States and stakeholders to work together in the context of
the National Energy and Climate Plans (NECPs)
25
and the Strategic Energy Technology
plan to continue developing a common approach to assessing and boosting the
competitiveness of the Energy Union. This is also important for the national recovery and
resilience plans that will be prepared under the Recovery and Resilience Facility.
2. OVERALL COMPETITIVENESS OF THE EU CLEAN ENERGY SECTOR
2.1 Energy and resource trends
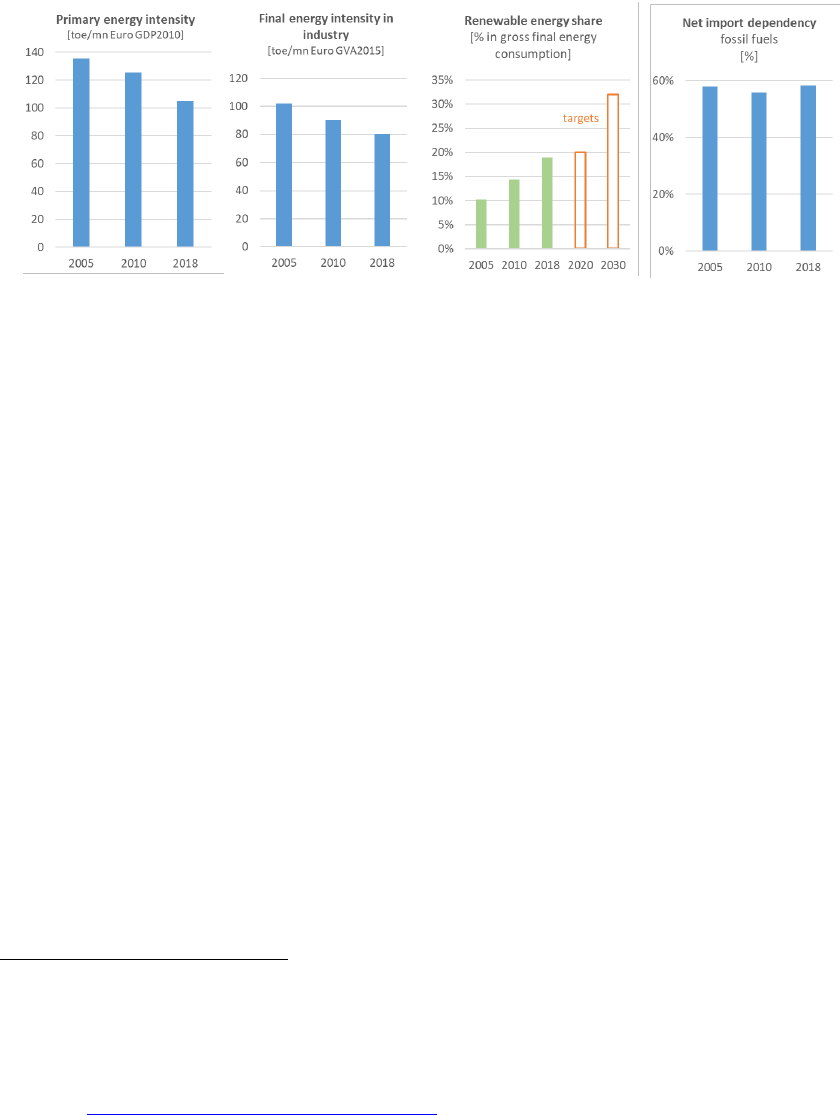
Over 2005-2018, primary energy intensity in the EU decreased at an average annual rate
of nearly 2%, demonstrating the decoupling of energy demand from economic growth.
Final energy intensity in industry and construction followed the same trend, albeit at a
21
This abbreviation means Production Communautaire (PRODCOM dataset).
22
Eg. the scope and role of alternative business models, as well as the role of SMEs and local actors.
23
For an overall mapping of competitiveness definitions, refer to JRC116838, Asensio Bermejo, J.M., Georgakaki, A,
Competitiveness indicators for the low-carbon energy industries - definitions, indices and data sources, 2020.
24
For an overview of missing data, see CETTIR (SWD(2020)953) chapter 5
25
This report builds on and complements the assessment and country-specific guidance of the NECPs (COM/2020/564
final), which include the topic of ‘research, innovation and competitiveness’.
5
slightly slower annual average rate of 1.8%, reflecting the sector’s efforts to reduce its
energy footprint. Enabled by energy policy, the share of renewable energy in final energy
consumption rose from 10% towards the 2020 target of 20%. The share of renewable
energy in the electricity sector rose to just over 32%. It increased to just over 21% in the
heating and cooling sector, while the figure for the transport sector was slightly over 8%.
This shows that the energy system has been shifting gradually towards clean energy
technologies (see Figure 1).
Figure 1 EU primary energy intensity, final energy intensity in industry, renewable energy share
and targets, and net import dependency (fossil fuels)
26
Source 1 EUROSTAT
During the last decade, industrial electricity prices in the EU
27
have remained relatively
stable, and are currently lower than Japan’s, but double those of the US and higher than
those of most non-EU G20 countries. Though industrial gas prices
28
have fallen, and are
lower than those in Japan, China and Korea, they remain higher than those of most non-
EU G20 countries. Relatively high non-recoverable taxes and levies in the EU and price
regulation and/or subsidies in the non-EU G20 play an important role in this difference.
Despite a short-term improvement and reduction in energy import dependency between
2008 and 2013, the EU has since experienced an increase
29
. In 2018, net import
dependency was 58.2%, just over the 2005 level, and almost equalling the highest values
over the period. Resource efficiency and economic resilience are key in being
competitive and enhancing the open strategic autonomy
30
of the EU in the clean energy
technology market. While clean energy technologies reduce dependence on imports of
fossil fuels, they risk replacing this dependence with on raw materials. This creates a new
type of supply risk
31
. However, unlike fossil fuels, raw materials have the potential to
stay in the economy through the implementation of circular economy approaches
32
, like
extended value chains, recycling, reuse and design for circularity, affecting the capital
expenditures and decreasing the energy need for extraction and processing of virgin
materials but not the operational expenditures of energy production. The EU is very
dependent on third countries for raw and processed materials. For some technologies,
however, it has a leading position in the manufacture of components and final products,
26
Energy Union indicators EE1-A1, EE3, DE5-RES, and SoS1.
27
EU weighted average (see COM(2020)951).
28
EU weighted average (see COM(2020)951).
29
Plausible reasons include the exhaustion of EU gas sources, weather variability, the economic crises and fuel shift.
30
COM(2020) 562 final.
31
COM(2020) 474 final and Critical Raw Materials for Strategic Technologies and Sectors in the EU - A Foresight
Study, https://ec.europa.eu/docsroom/documents/42882
32
The Circular Economy Action Plan puts in focus the creation of a secondary raw material market and design for
circularity (COM/2015/0614 final and COM/2020/98 final)
6
or high technology components. Specific, often high-tech materials show high supply
concentration in a handful of countries. (For instance, China produces over 80% of the
available rare earths for permanent magnet generators)
33
.
2.2 Share of EU energy sector in EU GDP
The turnover of the EU energy sector
34
was EUR 1.8 trillion in 2018, nearly the same
level as in 2011 (EUR 1.9 trillion). The sector contributes 2% of total gross value added
in the economy, a figure that has remained largely constant since 2011. The turnover of
the fossil fuel sector shrank from 36% (EUR 702 billion) of the overall energy sector
turnover in 2011 to 26% (EUR 475 billion) in 2018. At the same time, the turnover from
renewables increased over the same period from EUR 127 billion to EUR 146 billion
35
,
36
.
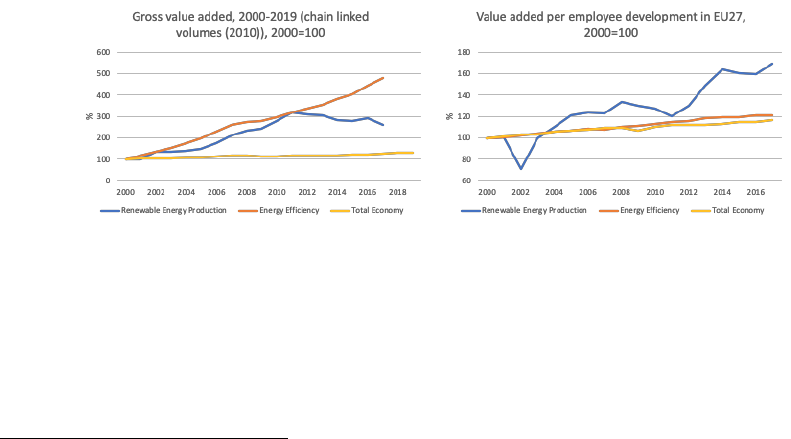
The value added of the clean energy sector (EUR 112 billion in 2017) was more than
double that of fossil fuel extraction and manufacturing activities (EUR 53 billion), having
tripled since 2000. The clean energy sector thus generates more value added that stays
within Europe than the fossil fuel sector.
Over 2000-2017, annual growth in the gross value added of renewable energy production
averaged 9.4%, while that of energy efficiency activities averaged 22.3%, far outpacing
the rest of the economy (1.6%). The labour productivity of the EU (gross value added per
employee) has also improved significantly in the clean energy sector, especially in the
renewable energy production sector, where it has risen by 70% since 2000.
Figure 2 Gross value added and value added per employee, 2000-2019, 2000=100
Source 2 JRC based on Eurostat data: [env_ac_egss1], [nama_10_a10_e], [env_ac_egss2],
[nama_10_gdp.
2.3 Human capital
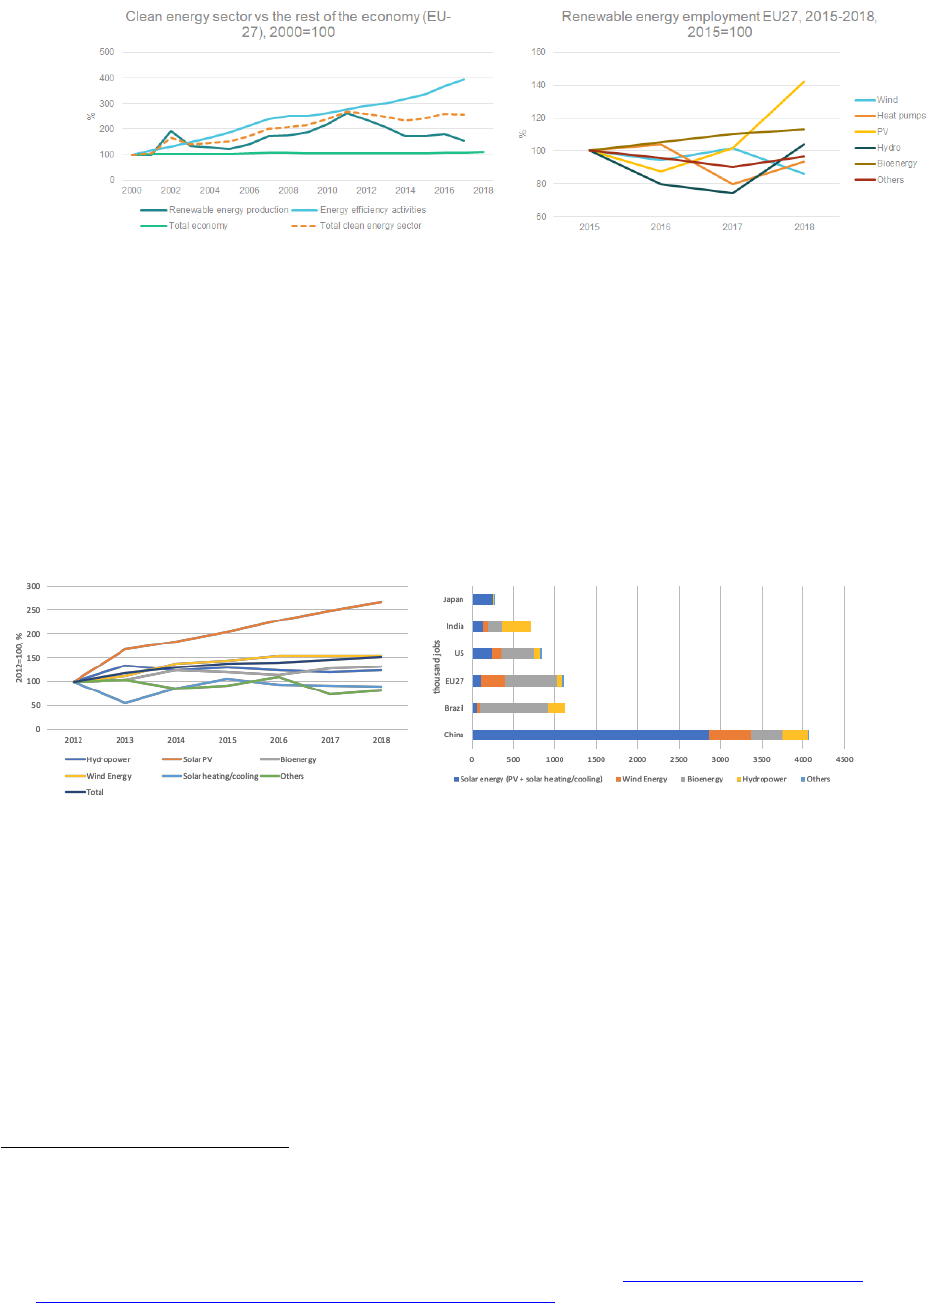
Clean energy technologies and solutions provide direct full-time employment for 1.5
million people in Europe
37
, of which more than half million
38
in renewables (growing to
33
D. T. Blagoeva, P. Alves Dias, A. Marmier, C.C. Pavel (2016) Assessment of potential bottlenecks along the
materials supply chain for the future deployment of low-carbon energy and transport technologies in the EU.
Wind power, photovoltaic and electric vehicles technologies, time frame: 2015-2030; EUR 28192 EN;
doi:10.2790/08169
34
This is based on Eurostat’s Structural Business Statistics Survey. The following codes are included: B05 (mining of
coal and lignite), B06 (extraction of crude petroleum and natural gas), B07.21 (mining uranium and thorium ores),
B08.92 (extraction of peat), B09.1 (support activities for petroleum and natural gas extraction), C19 (manufacture
of coke and refined petroleum products), and D35 (electricity, gas, steam and air conditioning supply).
35
Eurostat [sbs_na_ind_r2]
36
EurObserv'ER
37
To give some perspective, direct employment in fossil fuel extraction and manufacturing (NACE B05, B06, B08.92,
B09.1, C19) was 328,000 in the EU27 in 2018, while it was 1.2 million in the electricity, gas, steam and air

7
1.5 million when indirect jobs are also included) and almost 1 million in energy
efficiency activities (in 2017)
39
. Direct jobs in renewable energy production for the EU
grew from 327,000 in 2000 to 861,000 in 2011, falling to 502,000 in 2017. As Figure 3
shows, there was a decrease after 2011
40
, probably explained by the effect of the
financial crisis, including the subsequent relocation of manufacturing capacity, as well as
by increased productivity and a decrease in job intensity. The number of direct jobs in
energy efficiency increased steadily from 244,000 in 2000 to 964,000 in 2017. Direct
jobs in these sectors (RES and EE) represent about 0.7% of total employment in EU,
41
but their growth has outpaced the rest of the economy, with average annual growth of
3.1% and 17.4% respectively
42
.
conditioning sector (NACE D35), which supplies electricity from both renewable and fossil energy sources. The
total figure for the broad energy sector has remained largely stable, although employment has fallen by about
80,000 in the mining of coal and lignite and by about 30,000 in the extraction of crude petroleum and natural gas.
See: JRC120302, Employment in the Energy Sector Status Report 2020, EUR 30186 EN, Publications Office of
the European Union, Luxembourg, 2020.
38
If indirect jobs are also taken into account, the renewable energy sector employs nearly 1.4 million people in the
EU27, according to EurObserv'ER. EurObserv'ER includes in its estimate both direct and indirect employment.
Direct employment includes renewable equipment manufacturing, renewable plant construction, engineering and
management, operation and maintenance, biomass supply and exploitation. Indirect employment refers to
secondary activities, such as transport and other services. Induced employment is outside the scope of this
analysis. EurObserv'ER uses a formalised model to assess employment and turnover.
39
Eurostat Environmental Goods and Services Sector (EGSS) data is estimated by combining data from different
sources (SBS, PRODCOM, National Accounts). In EGSS, information is reported on the production of goods and
services that have been specifically designed and produced for the purpose of environmental protection or
resource management. The unit of analysis in EGSS is the establishment. The establishment is an enterprise or
part of an enterprise that is situated in a single location and in which a single activity is carried out or in which the
principal productive activity accounts for most of the value added. It is also tracked across all NACE codes. We
use CREMA 13A Production of energy from renewable sources and CREMA 13B for Heat/energy saving and
management.
40
This decrease can probably be explained by the effect of the financial crisis, including the subsequent relocation of
manufacturing capacity, as well as by increased productivity and a decrease in job intensity (Sources: JRC120302
Employment in the Energy Sector Status Report, 2020). The decrease was led by solar PV and by geothermal
energy to a lesser extent. The effect of the crisis was seen in the drop in solar PV installations and relocation of
manufacturing to Asia. For the onshore and offshore wind energy sector, increased productivity and thus
decreased job intensity can be particularly observed. Comparing direct employment with the cumulative installed
capacity in the last decade unveils a decrease of 47% and 59% in specific employment for the onshore and
offshore wind sector, respectively (sources: GWEC 2020, Global Offshore Wind Report, 2020; WindEurope
2020, Update of employment figures based on WindEurope, Local Impact Gl). Based on EurObserv’ER, job
intensity (jobs/MW) fell by 19% in wind and by 14% in solar PV over 2015-2018. Dynamics in the energy
efficiency sector are different (e.g. energy saving and efficiency has a direct positive impact through reduced
costs), and the growth in EE jobs can partially be explained by strong growth of jobs in the heat pump sector since
2012 (EurObservER). Overall, we can see from EurObserv’ER, which accounts for direct and indirect jobs, an
increasing trend for RES employment in the EU27.
41
Eurostat, EGSS.
42
In the rest of the economy, average annual growth has been 0.5%.
8
Figure 3 Direct employment in the clean energy sector vs the rest of the economy over 2000-
2018, 2000=100, and Renewable energy employment per technology, 2015-2018
Source 3 (JRC based on Eurostat data [env_ac_egss1], [nama_10_a10_e]
43
and
EurObserv'ER)
The growing trend of employment in the clean energy sector is global, although the
technologies that offer more employment opportunities vary by region. In general, jobs
have been created mainly in the solar PV and wind energy sectors. China, which has
almost 40% of all global jobs in renewables, employs most in solar PV, solar heating and
cooling, and wind energy; Brazil’s employment is in the bioenergy sector; and the EU
employ most people in bioenergy (about half of all RES jobs) and wind energy (about a
quarter), see Figure 4.
Figure 4 Global employment in renewable energy technology (2012-2018)
44
Source 4 (JRC based on IRENA, 2019
45
)
The clean energy technology sector continues to face challenges, in particular availability
of skilled workers at the locations where they are in demand.
46
,
47
The skills concerned
include, in particular, engineering and technical skills, IT literacy and ability to utilise
new digital technologies, knowledge of health and safety aspects, specialised skills in
carrying out work in extreme physical locations (for example at height or at depth), and
soft skills like team work and communication, as well as knowledge of the English
language.
As regards gender, women accounted for an average of 32% of the workforce in the
renewables sector in 2019
48
. This figure is higher than in the traditional energy sector
43
Renewable energy production refers to Eurostat EGSS code CREMA13A and energy efficiency activities to
CREMA13B.
44
The employment figures per country are for 2017.
45
IRENA. 2019. Renewable Energy and Jobs – Annual Review 2019.
46
Strategy baseline to bridge the skills gap between training offers and industry demands of the Maritime Technologies
value chain, September 2019 - MATES Project. https://www.projectmates.eu/wp-
content/uploads/2019/07/MATES-Strategy-Report-September-2019.pdf
47
Alves Dias et al. 2018. EU coal regions: opportunities and challenges ahead. https://ec.europa.eu/jrc/en/publi
cation/eur-scientific-and-technical-research-reports/eu-coal-regions-opportunities-and-challenges-ahead.
48
IRENA 2019: https://www.irena.org/publications/2019/Jan/Renewable-Energy-A-Gender-Perspective
9
(25%
49
) but lower than the share across the economy (46.1%
50
) and furthermore gender
balance differs to a higher extend for certain job profiles.
2.4 Research and innovation trends
In recent years, the EU has invested an average of nearly EUR 20 billion a year on clean
energy R&I prioritised by the Energy Union
51
,
52
. EU funds contribute 6%, public funding
from national governments accounts for 17%, and business contributes an estimated
77%.
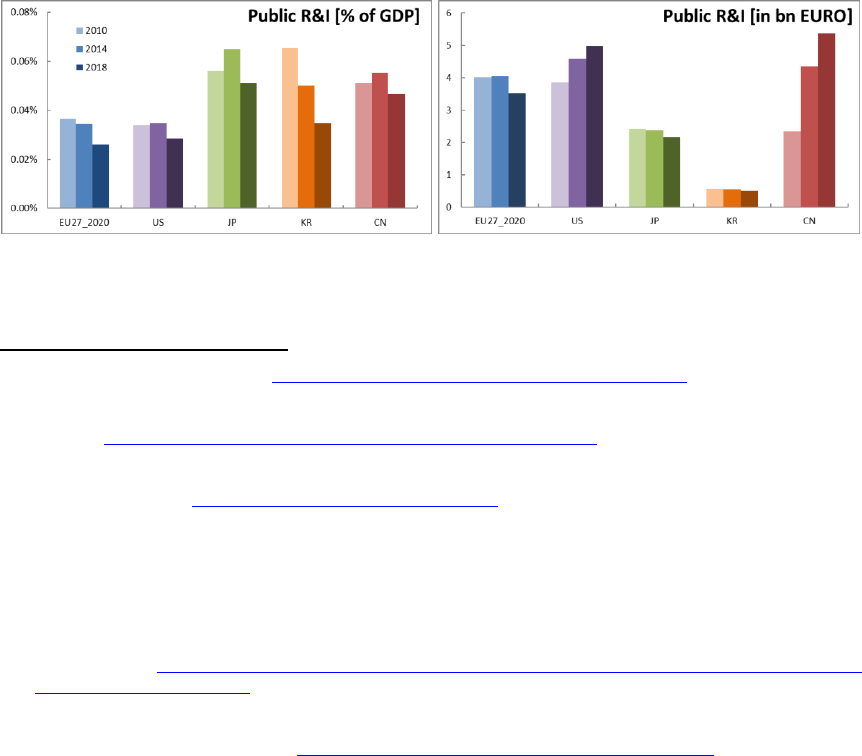
The R&I budget allocated to energy in the EU represents 4.7% of total spending on
R&I
53
. In absolute terms, however, Member States have reduced their national R&I
budgets for clean energy (Figure 5); in 2018 the EU spent half a billion less than in 2010.
This trend is global. Public sector R&I spending on low-carbon energy technologies was
lower in 2019 than in 2012, while countries continue to allocate large amounts of R&I
funding to fossil fuels
54
. This is the opposite of what is needed: R&I investments in clean
technologies need to increase if the EU and the world want to meet their decarbonisation
commitments. Today the EU has the lowest investment rate of all major global
economies measured as a share of GDP (Figure 5). EU research funds have been
contributing a larger share of public funding and have been essential in maintaining
research and innovation investment levels over the last four years.
Figure 5 Public R&I financing of Energy Union R&I priorities
55
Source 5 JRC
49
based on IEA
56
, MI
57
.
49
Eurostat (2019), retrieved from https://ec.europa.eu/eurostat/web/equality/overview
50
Eurostat [lfsa_egan2], 2019.
51
COM(2015)80; renewables, smart system, efficient systems, sustainable transport, CCUS and nuclear safety.
52
JRC SETIS https://setis.ec.europa.eu/publications/setis-research-innovation-data;
JRC112127 Pasimeni, F.; Fiorini, A.; Georgakaki, A.; Marmier, A.; Jimenez Navarro, J. P.; Asensio Bermejo, J.
M. (2018): SETIS Research & Innovation country dashboards. European Commission, Joint Research Centre
(JRC) [Dataset] PID: http://data.europa.eu/89h/jrc-10115-10001, according to:
JRC Fiorini, A., Georgakaki, A., Pasimeni, F. and Tzimas, E., Monitoring R&I in Low-Carbon Energy Technologies,
EUR 28446 EN, Publications Office of the European Union, Luxembourg, 2017.
JRC117092 Pasimeni, F., Letout, S., Fiorini, A., Georgakaki, A., Monitoring R&I in Low-Carbon Energy
Technologies, Revised methodology and additional indicators, 2020 (forthcoming).
53
Eurostat, Total GBAORD by NABS 2007 socio-economic objectives [gba_nabsfin07]. The energy socioeconomic
objective includes R&I in the field of conventional energy. The Energy Union R&I priorities would also fall under
other socioeconomic objectives.
54
IEA ETP https://www.iea.org/reports/clean-energy-innovation/global-status-of-clean-energy-innovation-in-
2020#government-rd-funding
55
Excludes EU funds.
56
Adapted from the 2020 edition of the IEA energy technology RD&D budgets database.
57
Mission Innovation Tracking Progress http://mission-innovation.net/our-work/tracking-progress/
10
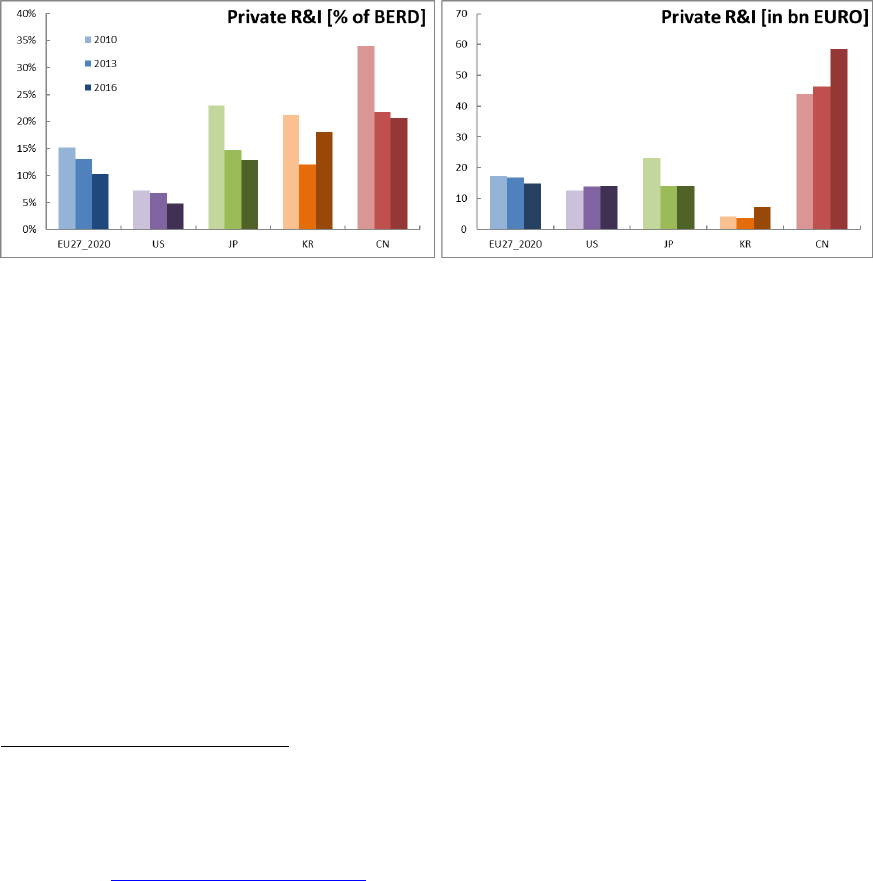
In the private sector, only a small share of revenue is currently being spent on R&I in the
sectors most in need of large-scale adoption of low-carbon technologies
51
. The EU have
estimated that private investment in Energy Union R&I priorities has been decreasing: it
currently amounts to around 10% of businesses’ total expenditure on R&I
58
. This is
higher than the US and comparable to Japan, but lower than China and Korea. A third of
this investment goes on sustainable transport, while renewables, smart systems and
energy efficiency receive about a fifth each. While the distribution of private R&I in the
EU has changed only slightly in recent years, there has been a more significant shift
globally towards industrial energy efficiency and smart consumer technologies
59
.
Figure 6 Estimates of private R&I financing of Energy Union R&I priorities
60
Source 6 JRC
49
, Eurostat/OECD
55
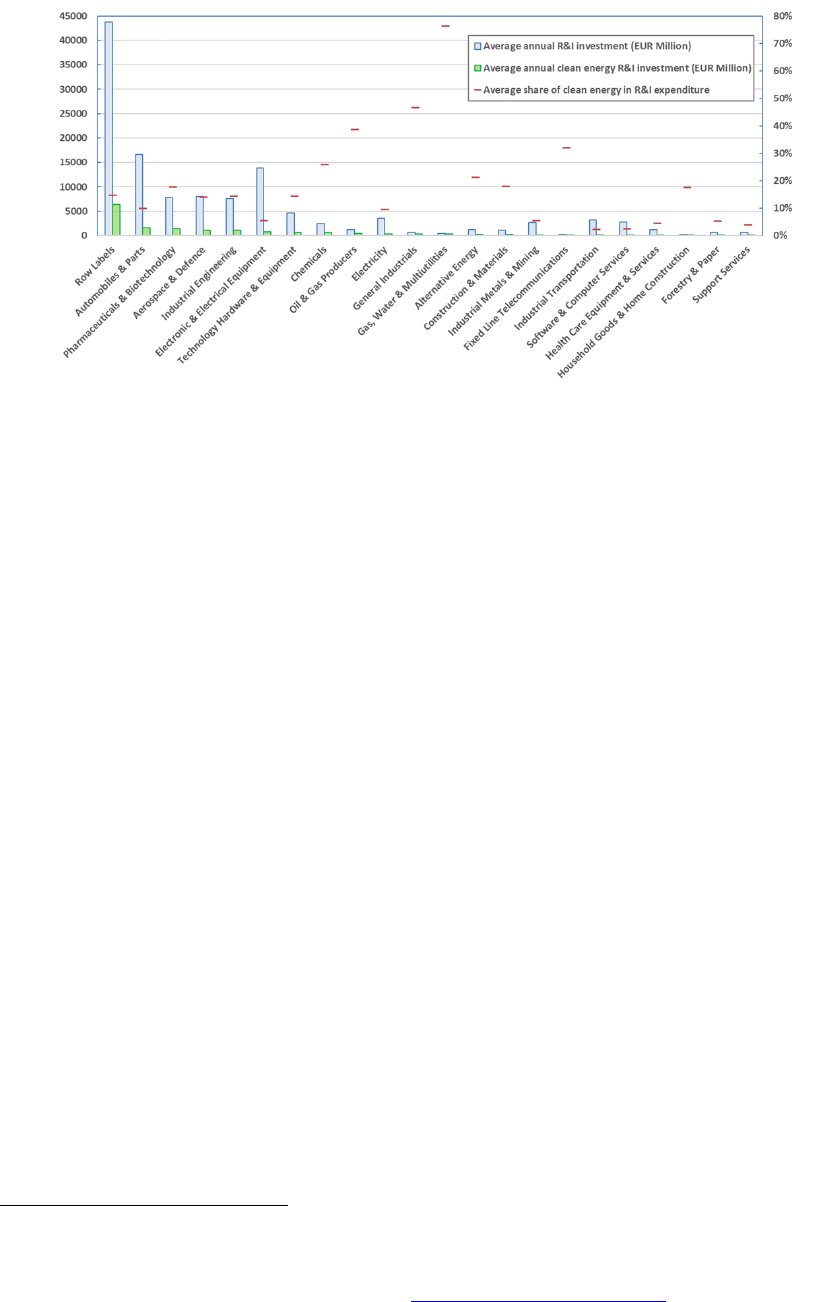
On average, major listed companies and their subsidiaries make up 20-25% of the main
investors, but account for 60-70% of patenting activity and investments. In the EU, the
automotive sector is the biggest private R&I investor in absolute terms in the Energy
Union R&I priorities
61
, followed by biotechnology and pharmaceuticals. Figure 7 shows
that among the energy industries, the oil and gas sector is the largest investor in R&I.
Other energy sectors, such as electricity or alternative energy companies, have much
lower budgets for R&I, although they spend more of it on clean energy. It is worrying
that a major share of the private budget for R&I in the energy sector is not spent on clean
energy technologies. According to the IEA, less than 1% of oil and gas companies’ total
capital expenditure has been outside their core business areas, on average
62
,
63
, and only
8% of their patents are in clean energy
64
.
Figure 7 EU R&I investment in Energy Union R&I priorities, by industrial sector
65
58
Contrasted with BERD statistics: Eurostat/OECD business expenditure on R&D (BERD) by NACE Rev. 2 activity
and source of funds [rd_e_berdfundr2]; The utilities sector includes water collection, treatment and supply
services; data not available for all countries.
59
JRC118288 input to Mission Innovation (2019) ‘Mission Innovation Beyond 2020: challenges and opportunities’.
60
Estimates for China are particularly challenging and uncertain, given differences in intellectual property protection
(see also https://chinapower.csis.org/patents/), and the difficulties faced in mapping company structures (e.g.
state-backed companies) and financial reporting.
61
This is a wider definition of what clean energy technology includes than that used in this report. For example, this
broader definition includes R&I in energy efficiency in industry.
62
With some leading individual companies spending around 5% on clean energy.
63
The oil and gas industry in energy transitions, world energy outlook special report, IEA, January 2020,
https://www.iea.org/reports/the-oil-and-gas-industry-in-energy-transitions
64
The Energy Transition and Oil Companies’ Hard Choices – Oxford Institute for Energy Studies, July 2019; Rob
West, Founder, Thundersaid Energy & Research Associate, OIES and Bassam Fattouh, Director, OIES, page 4.
65
Top contributing sectors. Five-year average (2012-2016) per sector; a third of companies (non-listed, smaller
investors) cannot be allocated to a specific sector.
11
Source 7 JRC
49
Venture capital (VC) investment in clean energy had been increasing in recent years, but
remains low (just over 6-7%) compared with private-sector investment in R&I. So far,
2020 marks a significant global slowdown in VC investment in clean energy
technologies
66
.
Patenting activity in clean energy technologies
67
peaked in 2012, and has been in decline
since.
68
Within this trend, however, certain technologies that are increasingly important
for the clean energy transition (e.g. batteries) have maintained or even increased their
levels of patenting activity.
The EU and Japan lead among international competitors in high-value
69
patents on clean
energy technologies. Clean energy patents account for 6% of all high-value inventions in
the EU. The EU’s share is similar to that of Japan, and higher than China (4%), the US
and the rest of the world (5%), and second only to Korea (7%) in terms of competing
economies. The EU host a quarter of the top 100 companies in terms of high-value
patents in clean energy. The majority of inventions funded by multinational firms
headquartered in the EU are produced in Europe and, for the most part, by subsidiaries
located in the same country.
70
The US and China are the main IPO offices – and by
extension markets – targeted for protection of EU inventions.
2.5 Covid-19 Recovery
71
During the pandemic, the European energy system has proved to be resilient to shocks
stemming from the pandemic
72
and a greener energy mix has emerged, with coal power
generation in the EU falling by 34% and renewables providing 43% of power generation
66
JRC
52
and JRC analysis based on Pitchbook, and IEA data on CleanTech VC investments.
67
Low-carbon energy technologies under the Energy Union’s R&I priorities.
68
With the exception of China, where local applications keep increasing, without seeking international protection. (See
also: Are Patents Indicative of Chinese Innovation? https://chinapower.csis.org/patents/)
69
High-value patent families (inventions) are those containing applications to more than one office i.e. those seeking
protection in more than one country / market.
70
Incentives, language and geographical proximity explain major exceptions.
71
Based on JRC work on the impacts of Covid-19 on the energy system and value chain.s
72
SWD(2020) 104 - Energy security: good practices to address pandemic risks

12
in Q2 2020, the highest share to date
73
. At the same time, the stock market performance
of the clean energy sector has seemed less affected and recovered more quickly than
fossil-fuel sectors. Digitalisation has helped companies and sectors respond successfully
to the crisis, also boosting the emergence of new digital applications.
Although the EU energy value chains are recovering, the crisis has brought to the
forefront the question of optimising and potentially regionalising supply chains, to reduce
exposure to future disruptions and improve resilience. In response, the Commission aims
to identify the critical supply chains for energy technologies, analyse potential
vulnerabilities and improve their resilience
74
. The key energy priorities in recovery are
energy efficiency in particular through the renovation wave, renewable energy sources,
hydrogen and energy system integration. There is a further concern that the pandemic is
affecting investments in and resources available for R&I, as has demonstrably happened
in previous economic crises.
Recovery measures can take advantage of the job creation potential offered by energy
efficiency and renewable energy
75
, including that of the R&I sector, to boost employment
while also moving towards sustainability. Support for R&I investment, including
corporate R&I, has a greater positive impact on employment in medium- to high-
technology sectors such as cleaner energy technology
76
. At the same time, breakthrough
low-carbon technologies are needed, for instance in energy-intensive industries, which
will require faster R&I investment for their demonstration and deployment.
3. FOCUS ON KEY CLEAN ENERGY TECHNOLOGIES AND SOLUTIONS
In the section below, the most relevant competitiveness values for each of the six
technologies analysed above, and the status, value chain and global market are analysed,
based on the indicators outlined in Table 1. The EU's performance is compared as far as
possible with other key regions (e.g. USA, Asia). A more detailed assessment of other
important clean and low carbon energy technologies needed to reach climate neutrality is
set out in the accompanying Clean Energy Transition – Technologies and Innovation
Report
77
.
3.1 Offshore renewables – wind
Technology: the EU cumulative installed capacity of offshore wind (OW) amounted to
12 GW in 2019
78
. At the 2050 time horizon, EU scenarios foresee approximately 300
GW of wind offshore capacity in the EU
79
. Globally, costs have fallen steeply in recent
years, and demand has been stimulated by new tenders implemented worldwide and the
building of subsidy-free wind parks. OW has benefited considerably from onshore wind
developments, especially economies of scale (e.g. material developments and common
73
Quarterly Report on European Electricity Markets, Volume 13, Issue 2. https://ec.europa.eu/energy/data-
analysis/market-analysis_en?redir=1
74
The analysis is supported by a study planned to deliver its conclusions in April 2021.
75
It is estimated that the same level of spending will generate nearly three times as many jobs as in fossil-fuelled
industries Source: Heidi Garrett-Peltier, Green versus brown: Comparing the employment impacts of energy
efficiency, renewable energy, and fossil fuels using an input-output model, Economic Modelling, Volume 61, 2017,
439-447
76
EC work for MI Tracking Progress: The Economic Impacts of R&D in the Clean Energy Sector and COVID-19,
2020, MI Webinar, May 6, 2020
77
SWD(2020)953
78
GWEC, Global Wind Energy Report 2019 (2020).
79
According to the CTP-MIX scenario from COM(2020) 562 final.
13
components), thereby allowing efforts to focus on the technology’s most innovative
segments (such as floating offshore wind, new materials and components). Recent
offshore wind projects have observed much increased capacity factors. The average
power capacity of the turbines has increased from 3.7 MW (2015) to 6.3 MW (2018),
thanks to sustained R&I efforts.
R&I in offshore wind revolves mainly around increased turbine size, floating
applications (particularly substructure design), infrastructure developments, and
digitalisation. About 90% of EU R&I funding for wind comes from the private sector
80
.
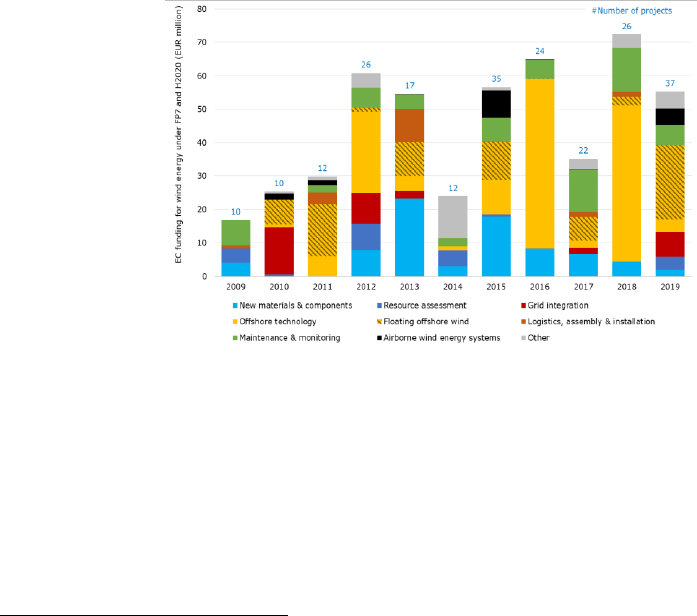
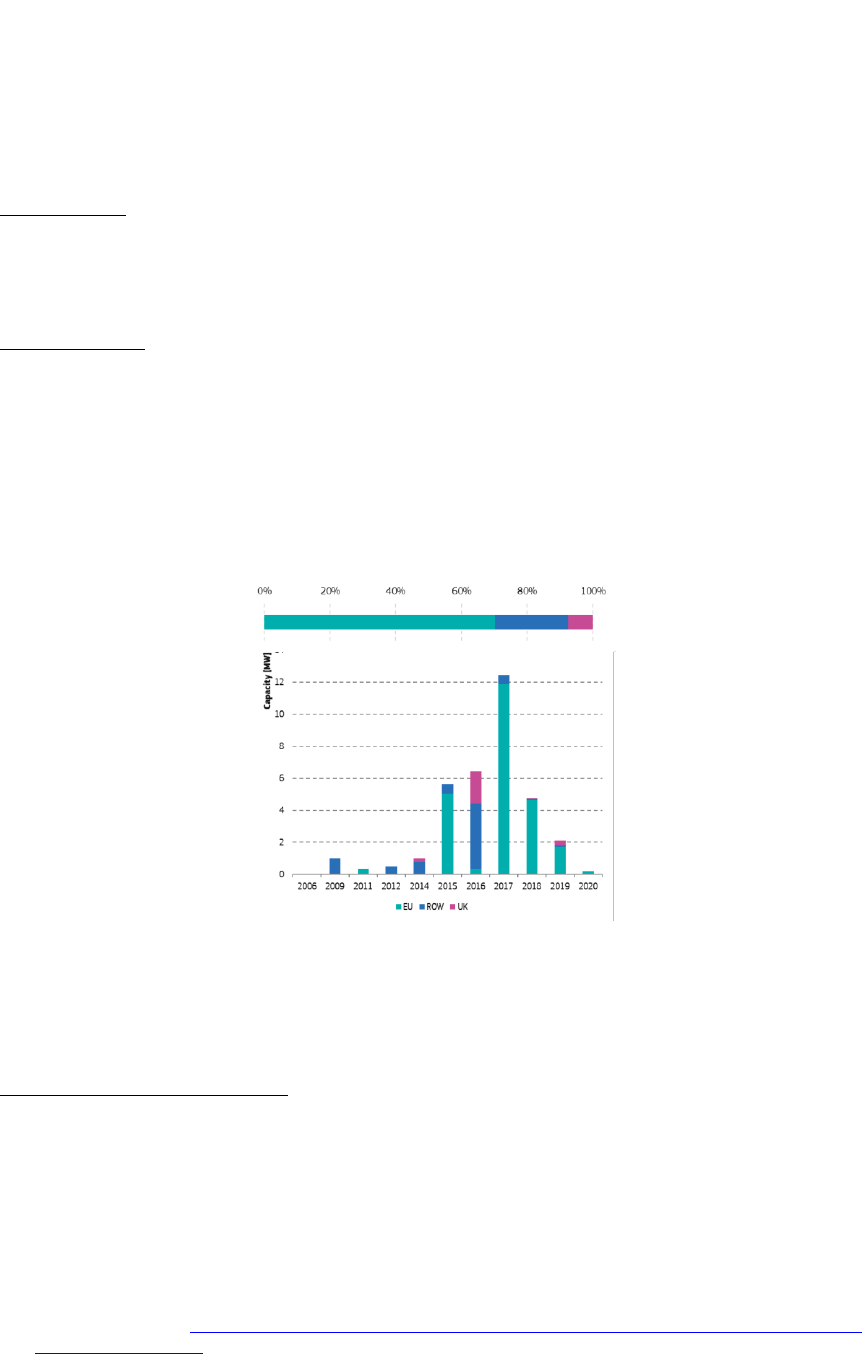
At EU level, offshore wind R&I has been supported since the 1990s. Offshore wind, in
particular floating, have received substantial funding in recent years (Figure 8). These
R&I patterns highlight that through the development of new market segments the EU
could establish a competitive edge. For example, a fully-fledged EU OW supply chain
(extended also to untapped EU sea basins), leadership in floating offshore industry
targeting markets with deeper waters or new emerging concepts e.g. airborne wind
systems or the development of a port infrastructure capable to deliver the ambitious
targets (and synergies to other sectors e.g. hydrogen production in ports). Patenting
trends confirm Europe’s competitiveness in wind energy. EU players are leading in high
value inventions
81
and they protect their knowledge in other patent offices outside their
home market.
Figure 8 Evolution of EC R&I funding, categorised by R&I priorities for wind energy under FP7
and H2020 programmes and the number of projects funded over 2009-2019.
Source 8 JRC 2020
82
Other recent innovations target the logistics/supply chain, e.g. the development of wind
turbine gearboxes compact enough to fit into a standard shipping container
83
as well as
applying circular economy approaches along the life-cycle of installations. Further
innovations and trends expected to increase most over the next ten years include
superconducting generators, advanced tower materials and the added value of offshore
wind energy (system value of wind). The SET Plan Group on OW identified most of
80
JRC Technology Market Report – Wind Energy (2019).
81
This means that the patents are protected in other patent offices outside the issuing country and refer to patent
families that include patent applications in more than one patent office. About 60% of all EU wind-related
inventions were protected in other countries (by way of a comparison, only 2% of Chinese inventions were
protected in other patent offices outside China).
82
JRC 2020, Low Carbon Energy Observatory, Wind Energy Technology Development Report 2020, European
Commission, 2020, JRC120709.
83
SET-Plan, Offshore Wind Implementation Plan (2018).
14
these areas as key for Europe to remain competitive in the future. Currently, Europe is
leading in all parts of the value chain of sensing and monitoring systems for OW
turbines, including research and production
84
.
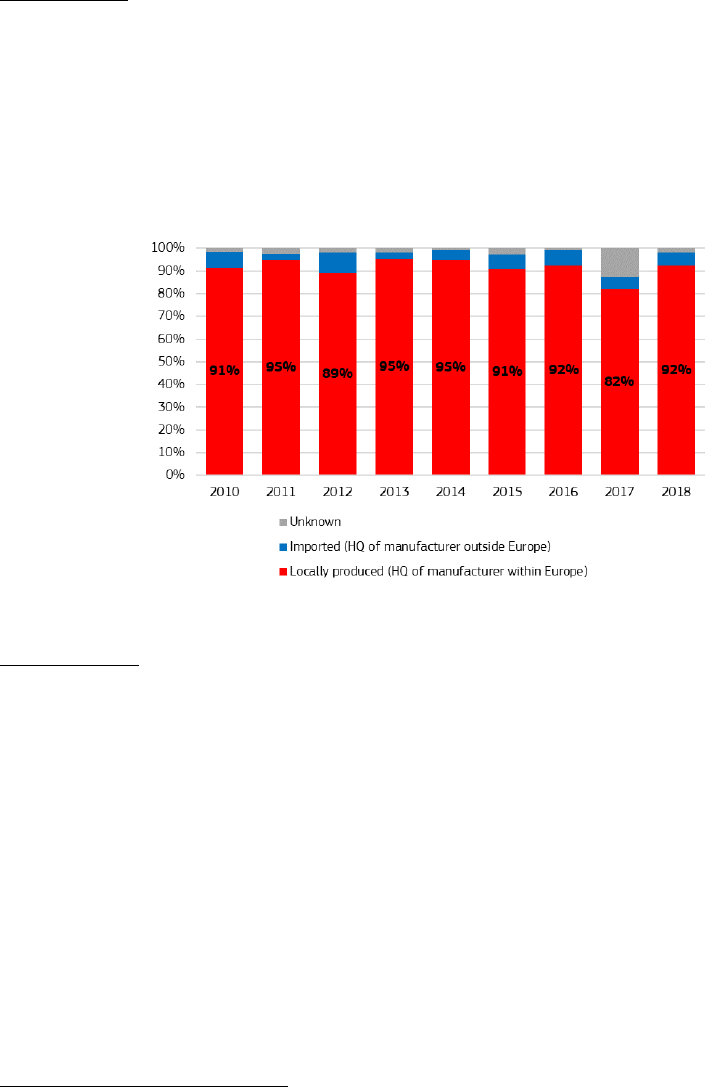
Value chain: On the market side, EU companies are ahead of their competitors in
providing offshore generators of all power ranges, reflecting a well-established European
offshore market and the increasing size of newly installed turbines
85
. Currently, about
93% of the total offshore capacity installed in Europe in 2019 is produced locally by
European manufacturers (Siemens, Gamesa Renewable Energy, MHI Vestas and
Senvion
86
).
Figure 9 Newly installed wind capacity (onshore & offshore) - local vs imported, assuming an
European single market
Source 9 JRC 2020
87
Global market: the EU
88
share of global exports increased from 28% in 2016 to 47% in
2018, and 8 out of the top 10 global exporters were EU countries, with China and India
being the key global competitors. Between 2009 and 2018, the EU
89
trade balance
remained positive, showing a rising trend.
In terms of global markets projections, within Asia (including China), offshore wind
capacity is expected to reach around 95 GW by 2030 (out of a projected global capacity
of almost 233 GW by 2030)
90
. Nearly half of global offshore wind investment in 2018
took place in China
91
. At the same 2030 time horizon, the CTP-MIX scenario projects 73
GW of wind offshore capacity in the EU. Currently, the NECPs project 55 GW of
offshore wind capacity by 2030.
Floating applications seem to become a viable option for EU countries and regions
lacking shallower waters (floating OW farms for depths between 50 and 1000 metres)
and could open up new markets based on areas such as the Atlantic Ocean, the
84
ICF, commissioned by DG Grow – Climate neutral market opportunities and EU competitiveness study (2020)
85
JRC Technology Market Report – Wind Energy (2019).
86
An even stronger market concentration can be expected following the insolvency of Senvion and the closure of its
Bremerhaven turbine manufacturing plant at the end of 2019.
87
JRC 2020, Facts and figures on Offshore Renewable Energy Sources in Europe, JRC121366 (upcoming).
88
EU including UK.
89
EU including UK.
90
GWEC 2020, Global Offshore Wind Report, 2020.
91
IRENA – Future of wind (2019, p. 52).

15
Mediterranean and, potentially, the Black Sea. A number of projects are planned or
underway that will lead to the installation of 350 MW of floating capacity in European
waters by 2024. Moreover, the EU wind industry aims to install floating OW farms with
150 GW of capacity by 2050 in European waters with a view to achieving climate
neutrality
92
. The global market for energy from floating OW farms represents a
considerable commercial opportunity for EU companies. A total of about 6.6 GW from
this source are expected by 2030, with significant capacities in certain Asian countries
(South Korea and Japan), in addition to the European markets (France, Norway, Italy,
Greece, Spain) between 2025 and 2030. Since China has abundant wind resources in
shallow waters, it is not expected to build floating wind farms with significant capacity in
the medium term
93
. Floating applications can also reduce under-water environmental
impacts, notably during the construction phase.
Offshore wind is a competitive industry on the global market. Emerging global market
demands, such as that for energy generated by floating wind farms, may become key to
EU industry if it is to be competitive in the growing offshore wind industry, and remain
so. A key consideration is whether Member States will commit to wind energy. The
current mismatch between the 2030 NECP projection (55 GW of offshore wind) and the
EU’s scenario (73 GW
94
) means that investment must be stepped up. The positive impact
of offshore wind development on supply chains in sea basins is relevant to regional
development (location of manufacturing, assembly of turbines close to the market,
impact on port infrastructure). The offshore renewable energy strategy
95
will define a set
of measures to overcome challenges and boost offshore prospects.
3.2 Offshore renewables – Ocean energy
Technology: tidal and wave energy technologies are the most advanced of the ocean
energy technologies, with significant potential located in a number of Member States and
regions
96
. Tidal technologies can be considered as being at the pre-commercial stage.
Design convergence has helped the technology develop and generate a significant
amount of electricity (over 30 GWh since 2016
97
). A number of projects and prototypes
have been deployed across Europe and worldwide. Most of the wave energy
technological approaches, however, are at technology readiness level (TRL) 6-7, with a
strong focus on R&I. Most improvements in wave energy results stem from ongoing
projects in the EU. Over the past five years, the sector has shown resilience
98
and
significant technology progress has been achieved thanks to the successful deployment of
demonstration and first-of-a-kind farms.
99
The LTS scenarios foresee limited uptake of ocean energy technology. The high cost of
wave and tidal energy converters and the limited information available on the
performance limit the capture of ocean energy in the model
100
. At the same time, the
92
ETIPWind, Floating Offshore Wind. Delivering climate neutrality (2020).
93
GWEC 2020, Global Offshore Wind Report, 2020.
94
The CTP-MIX scenario from COM(2020) 562 final.
95
It is anticipated that this will be published later in 2020.
96
There is significant potential to develop tidal energy in France, Ireland and Spain, and localised potential in other
Member States. As regards wave energy, high potential is to be found in the Atlantic, localised potential in the
North Sea, the Baltic, the Mediterranean, and the Black Sea.
97
Ofgem Renewable Energy Guarantees Origin Register. https://www.renewablesandchp.ofgem.gov.uk/
98
European Commission (2017) Study on Lessons for Ocean Energy Development, EUR 27984.
99
Magagna & Uihllein (2015) 2014 JRC Ocean Energy Status Report.
100
In the years to come, EU energy modelling results can be expected to reflect the validation and cost reduction of
these technologies.
16
European Green Deal emphasises the key role marine renewable energy will play in the
transition to a climate-neutral economy, with a significant contribution expected under
the right market and policy conditions (2.6 GW by 2030
101
and 100 GW in European
waters by 2050
102
). Ongoing demonstrations show that costs can be reduced fast: data
from Horizon 2020 projects indicate that the cost of tidal energy fell by over 40%
between 2015 and 2018
103
,
104
.
Value chain: European leadership spans the whole ocean energy supply chain
105
and
innovation system
106
. The European cluster formed by specialised research institutes,
developers and the availability of research infrastructure has enabled Europe to develop
and maintain its current competitive position.
Global market: the EU maintains global leadership despite the UK’s withdrawal from the
bloc and changes in the market for wave and tidal energy technologies. 70% of global
ocean energy capacity has been developed by EU-based companies
107
. Over the next
decade it will be vital for EU developers to build on their competitiveness position.
Global ocean energy capacity is expected to increase to 3.5 GW within the next five
years, and an increase of up to 10 GW can be expected by 2030
108
.
Figure 10 Installed capacity by origin of technology
Source 10 JRC 2020
109
Within the EU
110
, 838 companies in 26 countries filed patents or were involved in the
filing of patents to do with ocean energy between 2000 and 2015
111
. The EU has long
maintained technological leadership in developing ocean energy technologies, thanks to
101
European Commission (2018) Market study on ocean energy.2.2GW of tidal stream and 423MW of wave energy.
102
European Commission (2017) Ocean energy strategic roadmap: building ocean energy for Europe.
103
JRC (2019) Technology Development Report LCEO: Ocean Energy.
104
In addition, R&I in the fields of advanced and hybrid materials, new manufacturing processes and additive
manufacturing employing innovative 3D technologies could enable costs to be reduced further. It could also help
reduce energy consumption, shorten lead times and improve quality associated with the production of large
cast components.
105
JRC (2017) Supply chain of renewable energy technologies in Europe.
106
JRC (2014) Overview of European innovation activities in marine energy technology.
107
JRC (2020) - Facts and figures on Offshore Renewable Energy Sources in Europe, JRC121366 (upcoming).
108
EURActive (2020) https://www.euractiv.com/section/energy/interview/irena-chief-europe-is-the-frontrunner-on-
tidal-and-wave-energy/
109
JRC (2020) - Facts and figures on Offshore Renewable Energy Sources in Europe, JRC121366 (upcoming).
110
EU including UK.
111
JRC (2020) Technology Development Report Ocean Energy 2020 Update.

17
the sustained support provided for R&I. Between 2007 and 2019, total R&I expenditure
on wave and tidal energy amounted to EUR 3.84 billion, most of which (EUR 2.74
billion) came from private sources. In the same period, national R&I programmes
contributed EUR 463 million to the development of wave and tidal energy, while EU
funds supported R&I to the tune of almost EUR 650 million (including NER300 and
Interreg projects (co-funded by the European Regional Development Fund))
112
. On
average, EUR 1 billion of public funding (EU
113
and national) leveraged EUR 2.9 billion
of private investments in the course of the reporting period.
Significant cost reduction is still needed for tidal and wave energy technologies to exploit
their potential in the energy mix, for which intensified (i.e. increased rate of projects in
the water) and continued (i.e. continuity of projects) demonstration activities are
necessary. Despite advances in technology development and demonstration, the sector
faces a struggle in creating a viable market. National support appears low, reflected by
the limited commitment to ocean energy capacity in the NECPs compared to 2010 and
the lack of clear dedicated support for demonstration projects or for the development of
innovative remuneration schemes for emerging renewable technologies. This limits scope
for developing a business case and for identifying viable ways to develop and deploy the
technology. Specific business cases for ocean energy therefore need more focus, in
particular when its predictability can enhance its value, as well its potential for
decarbonising small communities and EU islands
114
. The upcoming offshore renewable
energy strategy offers an opportunity to support the development of ocean energy and
enable the EU to exploit its resources across the EU to the full.
3.3 Solar photovoltaics (PV)
Technology: solar PV has become the world’s fastest-growing energy technology, with
demand for solar PV spreading and expanding as it becomes the most competitive option
for electricity generation in a growing number of markets and applications. This growth
is supported by the decreasing cost of PV systems (EUR/W) and increasingly competing
cost of electricity generated (EUR/MWh).
The EU
115
cumulative PV installed capacity amounted to 134 GW in 2019, and it is
projected to grow to 370 GW in 2030, and to 1051 GW in 2050
116
. Given the significant
projected growth of PV capacity in the EU and globally, Europe should have a sizeable
role in the whole value chain. At the moment, European companies perform differently
across the various segments of the PV value chain (Figure 11).
Figure 11 European players across the PV industry value chain
112
JRC calculation, 2020.
113
EU funds awarded up to 2020 included UK recipients.
114
European Commission (2020), The EU Blue Economy Report, 2020.
115
EU including UK.
116
According to the projections in the Impact Assessment supporting the Climate Target Plan (COM(2020) 562 final.)

18
Source 11 ASSET study on competitiveness
Value chain: EU companies are competitive mainly in the downstream part of the value
chain. In particular, they have managed to remain competitive in the monitoring, control
and balance of system (BoS) segments, hosting some of the leaders in inverter
manufacturing and in solar trackers. EU companies have also maintained a leading
position in the deployment segment, where established players like Enerparc, Engie, Enel
Green Power or BayWa.re have been able to gain new market share worldwide
117
.
Furthermore, equipment manufacturing still has a strong base in Europe (e.g. Meyer
Burger, Centrotherm, Schmid).
Global market: the EU has lost its market share in some of the upstream parts of the
value chain (e.g. solar PV cell and module manufacturing). The highest value added is
located both a long way upstream (in basic and applied R&D, and design) and a long way
downstream (in marketing, distribution, and brand management). Even though the lowest
value-added activities occur in the middle of the value chain (manufacturing and
assembly), companies have an interest in being well positioned in these segments, to
reduce risks and financing costs. The EU still hosts one of the leading polysilicon
manufacturers (Wacker Polysilicon AG), whose production alone is sufficient to
manufacture 20 GW of solar cells, and which exports a significant part of its polysilicon
output to China
118
. Currently, global production of PV panels is valued at about EUR
57.8 billion, with the EU accounting for EUR 7.4 billion (12.8%) of that amount. The EU
still accounts for a relatively high share of the segment’s total value, thanks to the
production of polysilicon ingots. However, it has fallen back dramatically in the
manufacture of PV cells and modules. All the top 10 producers of PV cells and modules
now produce most of their output in Asia
119
.
117
ASSET Study on Competitiveness, 2020.
118
JRC PV Status Report, 2011.
119
Izumi K., PV Industry in 2019 from IEA PVPS Trends Report, ETIP PV conference “Readying for the TW era,
May 2019, Brussels
Market Size
(M€)
Equipment for
PV
manufacturing
Monitoring &
Controls
Solar PV
panels (Silicon,
Cells, Modules)
EPC
Balance of
system
Deployment
Key players
EU
• Valoe
• Centrotherm
• SCHMID
• Hanwha Q-cells
(Partially EU)
• Wacker Chemie
• 3Sun
• GreenPower
Monitoring
• AlsoEnergy
(partially EU)
• Solar-log
• Meteo&Control
Inverters
• SMA
Trackers
• Soltec
Highly fragmented
market dominated by
local players
• Enel Green Power
• Engie
• BayWa.re
Market
Growth
Outlook
R&D directed to HJT Focus on increasing
cell efficiency
Focus diagnostics
and optimisation
Increasing
warranties and cost
reduction
Focus on factory vs
field work
Access to low cost
capital and leading
technology is key
Critical
materials
None
Silver, Copper
None None None None
Key
activities
• PV manufacturing
equipment
• New PV technology
development
• Manufacturing of
silicon ingots, cells
and PV modules
• Developing
hardware and
software to improve
the performance of
solar farm
• All non-module
hardware (Inverters,
Trackers, Steel
structures, cabling,
etc.)
• Engineering design
• Construction
• Lease & Insurance
• Commissioning
• Development
• Finance
• O&M
57.842
7.368
EUGlobal
1.329
66
Global EU
2.694
678
Global EU
25.707
3.275
EUGlobal
17.995
2.292
EUGlobal
26.993
3.438
Global EU
EU: Global:
Key players
Rest of the
World
• Meyer Burger
• Trina Solar
• Jinko Solar
• GCL-Si
• Hanwha Q-cells
(Partially KR)
• JA Solar
• Longi
• Tongwei
• AlsoEnergy
(Partially US)
• Inaccess
Inverters
• Huawei
• SunGrow
Trackers
• Nextrack
er
• Array
Tech
Highly fragmented
market dominated by
local players
• Nexterra
• BP Lightsource
>15% >10% >5% >0%
Legend:
(10 year CAGR)
EU: Global: EU: Global: EU: Global: EU: Global: EU: Global:

19
Capital expenditure costs for polysilicon, solar cell and module manufacturing plants fell
dramatically between 2010 and 2018. Together with innovations in manufacturing, this
should offer an opportunity for the EU to take a fresh look at the PV manufacturing
industry and reverse the situation
120
.
The EU’s presence in the far upstream and far downstream parts of the value chain could
well provide a basis for rebuilding the PV industry. This would require a focus on
specialisation or high-performance/high-value products, such as equipment and inverter
manufacturing and PV products tailored to the specific needs of the building sector,
transport (vehicle integrated PV) and/or agriculture (dual land use with AgriPV), or to
the demand for high-efficiency/high-quality solar power installations to optimize use of
available surfaces and of resources. The modularity of the technology makes it easier to
integrate PV in a number of applications, especially in the urban environment. These
novel PV technologies, which are now reaching the commercial phase, could offer a new
basis for rebuilding the industry
121
. The strong knowledge of the EU research institutions,
the skilled labour force, and the existing and emerging industry players provide a basis
for re-establishing a strong European photovoltaic supply chain
122
. To remain
competitive, such industry needs to develop a global outreach. Building a sizeable EU
PV manufacturing industry would also reduce the risk of supply disruptions and quality
risks.
3.4 Renewable hydrogen production through electrolysis
This section focuses on renewable hydrogen production and on the competitiveness of
this first segment of the hydrogen value chain
123
. Hydrogen is key to to store energy
produced by renewable electricity and to decarbonise sectors that are hard to electrify.
The aim of the EU hydrogen strategy is to integrate 40 GW of renewable hydrogen
124
electrolysers and the production of up to 10 Mt of renewable hydrogen in the EU energy
system by 2030, with direct investment of between EUR 24 billion and EUR 42
billion
125
,
126
.
Technology: the capital cost of electrolysers has fallen by 60% in the last decade, and is
expected to halve again by 2030, compared to the present day, thanks to economies of
120
Arnulf Jäger-Waldau, Ioannis Kougias, Nigel Taylor, Christian Thiel, How photovoltaics can contribute to GHG
emission reductions of 55% in the EU by 2030, Renewable and Sustainable Energy Reviews,
Volume 126, 2020, 109836, ISSN 1364-0321
121
Here are a few examples of the most relevant PV manufacturing initiatives in Europe. i) The H2020 ‘Ampere’
project supporting the construction of a pilot line to produce heterojunction silicon solar cells and modules. The 3Sun
Factory (Catania, Italy) produces one of the most efficient PV technologies based on this approach. ii) The Oxford PV
initiative for manufacturing PV solar cells based on perovskite materials, receiving an EIB loan under the InnovFin
EDP facility. iii) Meyer Burger’s patent-protected heterojunction/SmartWire technology, which is more efficient than
the current standard mono-PERC, as well as other heterojunction technologies currently available.
122
Assessment of Photovoltaics (PV) Final Report, Trinomics (2017).
123
On-site hydrogen production for co-located consumption in industrial applications appears to be a promising pattern
which could enable the scale for the wider introduction of the carrier in the energy system to be reached fast, in
line with the ambition of a climate-neutral economy and the hydrogen strategy. The competitiveness of the other
supply chain segments, such as the transport of hydrogen, its storage and its conversion in end-use applications
(e.g. mobility, buildings) is not dealt with in this report. The Commission has set up the European Clean
Hydrogen Alliance as a stakeholder platform to bring the relevant players together.
124
Renewable hydrogen (often referred to as ‘green hydrogen’) is hydrogen produced by electrolysers powered by
renewable electricity, through a process in which water is dissociated into hydrogen and oxygen.
125
A hydrogen strategy for a climate-neutral Europe, https://ec.europa.eu/energy/sites/ener/files/hydrogen_strategy.pdf
126
In addition, from now to 2030, an amount between EUR 220bn and EUR 340bn would be required to scale up and
connect 80-120 GW of solar and wind generators to the electrolysers to supply the necessary electricity.

20
scale
127
. The cost of renewable hydrogen
128
currently lies between EUR 3 and EUR 5.5
per kilo, making it more expensive than non-renewable hydrogen (EUR 2 (2018) per kilo
of hydrogen
129
).
Today, less than 1% of world hydrogen production comes from renewable sources
130
.
Projections for 2030 locate the cost of renewable hydrogen in the range of EUR 1.1-
2.4/kg
131
, which is cheaper than low-carbon fossil-based hydrogen
132
, and nearly
competitive with fossil-based hydrogen
133
.
Between 2008 and 2018, the Fuel Cells and Hydrogen Joint Undertaking (FCH JU)
supported 246 projects across several hydrogen-related technological applications,
reaching a total investment figure of EUR 916 million, complemented by EUR 939
million of private and national/regional investments. Under the Horizon 2020 programme
(2014-2018), over EUR 90 million was allocated to developing electrolysers,
complemented by EUR 33.5 million of private funds
134
,
135
. At national level, Germany
has deployed most resources, with EUR 39 million
136
allocated to projects devoted to
electrolyser development between 2014 and 2018
137
. In Japan, Asahi Kasei received a
multimillion dollar grant supporting the development of their alkaline electrolyser
138
.
Asia (mostly China, Japan and South Korea) dominates the total number of patents filed
between 2000 and 2016 for the hydrogen, electrolyser and fuel cell groupings.
Nevertheless, the EU performs very well and has filed the largest number of ‘high-value’
patent families in the fields of hydrogen and electrolysers. Japan, however, has filed the
largest number of ‘high-value’ patent families in the field of fuel cells.
127
From the hydrogen strategy: based on cost assessments by the IEA, IRENA and BNEF. Electrolyser costs to decline
from EUR 900/kW to EUR 450/KW or less in the period after 2030, and EUR 180/kW after 2040. The costs of
carbon capture and storage increase the costs of natural gas reforming from EUR 810/kWH2 to EUR 1512/kWH2.
For 2050, the costs are estimated at EUR 1152/kWH2 (IEA, 2019).
128
State of art for alkaline electrolyser efficiency is around 50 kWh/kgH2 (about 67% based on hydrogen lower
heating value (LHV)) and 55 kWh/kgH2 (about 60% based on hydrogen LHV) for PEM electrolysis. Energy
consumption for SOE is lower (of the order of 40 kWh/kgH2), but a source of heat is required in order to provide
the necessary high temperatures (>600°C).
https://www.fch.europa.eu/sites/default/files/MAWP%20final%20version_endorsed%20GB%2015062018%20%
28ID%203712421%29.pdf
129
https://www.iea.org/data-and-statistics/charts/hydrogen-production-costs-using-natural-gas-in-selected-regions-
2018-2 Original figure 1.7 USD - Conversation rate used: (EUR 1 = USD 1.18)
130
International Energy Agency, Hydrogen Outlook, June 2019, p. 32 – 2018 estimates.
131
COM(2020) 301 final
132
Refers to fossil-based hydrogen with carbon capture’ which is a subpart of fossil-based hydrogen, but where
greenhouse gases emitted as part of the hydrogen production process are captured.
133
Refers to hydrogen produced through a variety of processes using fossil fuels as feedstock COM(2020) 301 final.
134
JRC 2020‚ Current status of Chemical Energy Storage Technologies’, p. 63.
https://publications.jrc.ec.europa.eu/repository/bitstream/JRC118776/current_status_of_chemical_energy_storage
_technologies.pdf
135
Compared with EUR 472 million for FCH JU funding overall and EUR 439 million for other sources of funding.
136
This includes both private and public funds.
137
JRC 2020 ‚Current status of Chemical Energy Storage Technologies’, p. 63
https://publications.jrc.ec.europa.eu/repository/bitstream/JRC118776/current_status_of_chemical_energy_storage
_technologies.pdf
138
Yoko-moto, K., Country Update: Japan, in 6th International Workshop on Hydrogen Infrastructure and
Transportation, 2018.

21
Value chain: the main water electrolysis technologies are alkaline electrolysis (AEL),
polymer electrolyte membrane electrolysis (PEMEL) and solid oxide electrolysis
(SOEL)
139
:
- AEL is a mature technology with operational costs driven by electricity costs and high
capital cost. The research challenges are high-pressure operation and the coupling
with dynamic loads.
- PEMEL can reach significantly higher current densities
140
than AEL and SOEL, with
the potential to further reduce capital cost. In recent years, several large (MW-scale)
plants have been installed in the EU (in Germany, France, Denmark, and the
Netherlands), enabling the EU to catch up on AEL. It is a market-ready technology
with research mainly focused on increasing aerial power density, while guaranteeing
the simultaneous reduction of critical raw material use
141
and durability performance.
- SOEL exhibits greatest efficiency. However, plants are relatively smaller, usually still
in the 100 kW capacity range, require steady operation, and need to be coupled to a
heat source
142
. Overall, SOEL is still in the development phase, although it is possible
to order products on the market.
In 2019, the EU had around 50 MW of water electrolysis capacity installed
143
(about 30%
AEL and 70% PEMEL), of which about 30 MW were located in Germany in 2018
144
.
AEL has no critical components in its supply chain. Thanks to technical similarities with
the chlor-alkali electrolysis industry, which deploys much larger installations, it can
exploit technology overlap and benefit from well-established value chains.
145
. PEMEL
and SOEL share some cost and supply risks with the respective fuel cell value chains
146
.
This applies in particular to critical raw materials
147
in the case of PEMEL, and to rare
earths in the case of SOEL.
PEMEL has to withstand corrosive environments and therefore requires the use of more
expensive materials, such as titanium for bipolar plates. The main system-cost
contributors are the electrolyser stack
148
(40-60%), followed by the power electronics
(15-21%). The core components driving up the stack cost are the layers of membrane
electrode assemblies (MEA), which contain noble metals
149
. Cell components based on
rare earths that are used for SOEL electrodes and electrolyte are the main contributors to
139
A novel type of high temperature electrolyser, at a very low TRL, is under development: proton ceramic
Eeectrolysers (PCEL), with the potential advantage of producing pure dry pressurised hydrogen at the maximum
pressure of the electrolyser, unlike other electrolyser technologies.
140
Electrolysis is a surface-based process. Therefore, upscaling an electrolyser stack cannot take advantage of a
favourable surface/volume ratio as for volume-based processes. All other things remaining equal, doubling or
tripling the size of an electrolysis stack will almost double or triple the investment cost, with limited direct
economies coming from the scale-up. This is why the increased areal power density allowed in the PEMEL
approach is relevant. Obtaining higher hydrogen production for a given surface area of the electrolyser reduces the
capital cost and the overall footprint of the installation.
141
Mainly platinum group metals (PGMs), iridium in particular.
142
A recently started European project
142
is currently aiming to install 2.5 MW in an industrial environment.
143
https://iea.blob.core.windows.net/assets/a02a0c80-77b2-462e-a9d5-1099e0e572ce/IEA-Hydrogen-Project-
Database.xlsx
144
https://www.dwv-info.de/wp-content/uploads/2015/06/DVGW-2955-Brosch%C3%BCre-Wasserstoff-RZ-
Screen.pdf
145
https://www.fch.europa.eu/sites/default/files/Evidence%20Report%20v4.pdf
146
https://publications.jrc.ec.europa.eu/repository/handle/JRC118394
147
Iridium is currently crucial for PEM electrolysis only, but not for fuel cell systems. Since it is one of the rarest
elements in the earth’s crust, it is likely that any strain brought about by an increased additional demand will have
strong repercussions on availability and price.
148
A stack is the sum of all the cells.
149
https://www.fch.europa.eu/sites/default/files/Evidence%20Report%20v4.pdf

22
stack cost. It is estimated that stacks account for about 35% of overall SOEL system
cost
150
.
Global market: European companies are well-placed to benefit from market growth. The
EU has producers of all three main electrolyser technologies
151
, and is the only region
offering a well-defined market product for SOEL. The other players are located in the
UK, Norway, Switzerland, the US, China, Canada, Russia and Japan.
The global turnover for water electrolyser systems is currently estimated to be in the
range of EUR 100 to EUR 150 million per year. According to 2018 estimates, water
electrolysis production could reach a capacity of 2 GW per year (globally), within a very
short space of time (one to two years). European manufacturers could potentially supply
about one third of this increased global capacity
152
.
The aim of the EU’s hydrogen strategy is to achieve a significant renewable hydrogen
production capacity by 2030. This will require a tremendous effort to scale up from the
50 MW of water electrolysis capacity currently installed to 40 GW by 2030, with the
setting up of the capacity required for a sustainable value chain in the EU. This effort
should build on the innovation potential offered by the whole spectrum of the electrolyser
technologies and on the leading position EU companies have in electrolysis in all
technology approaches, along the whole value chain, from component supply to final
integration capability. Important cost reductions are expected as a result of scaling up
industrial scale manufacturing of electrolysers.
3.5 Batteries
Batteries are a key enabler for the transition to the climate-neutral economy we aim to
reach by 2050, for the roll-out of clean mobility, and for energy storage to enable the
integration of increasing shares of variable renewables. This analysis focuses on lithium
ion (Li-ion) battery technology. There are several reasons for this:
- the very advanced state of this technology and its market readiness;
- its high round trip efficiency;
- its considerable projected demand; and
- its expected broader use, be it in electric vehicles, future electric (maritime and
airborne) vessels, or in stationary and other industrial applications, leading to
considerable market opportunities.
Technology: global demand for Li-ion batteries is projected to increase from about 200
GWh in 2019 to about 800 GWh in 2025, and to exceed 2 000 GWh by 2030. Under the
most optimistic scenario, it could reach 4 000 GWh by 2040
153
.
150
https://www.hydrogen.energy.gov/pdfs/16014_h2_production_cost_solid_oxide_electrolysis.pdf
151
AEL is provided by nine EU producers (four in Germany, two in France, two in Italy and one in Denmark), two in
Switzerland and one in Norway, two in the US, three in China, and three in other countries (Canada, Russia and
Japan). PEMEL is provided by six EU suppliers (four in Germany, one in France and one in Denmark), one
supplier from the UK and one from Norway, two suppliers from the US, and two suppliers from other countries.
SOEL are provided by two suppliers from the EU (Germany and France).
152
https://www.now-gmbh.de/content/service/3-publikationen/1-nip-wasserstoff-und-
brennstoffzellentechnologie/181204_bro_a4_indwede-studie_kurzfassung_en_v03.pdf
153
Source: JRC Science for Policy Report: Tsiropoulos I., Tarvydas D., Lebedeva N., Li-ion batteries for mobility and
stationary storage applications – Scenarios for costs and market growth, EUR 29440 EN, Publications Office of
the European Union, Luxembourg, 2018, doi:10.2760/87175.
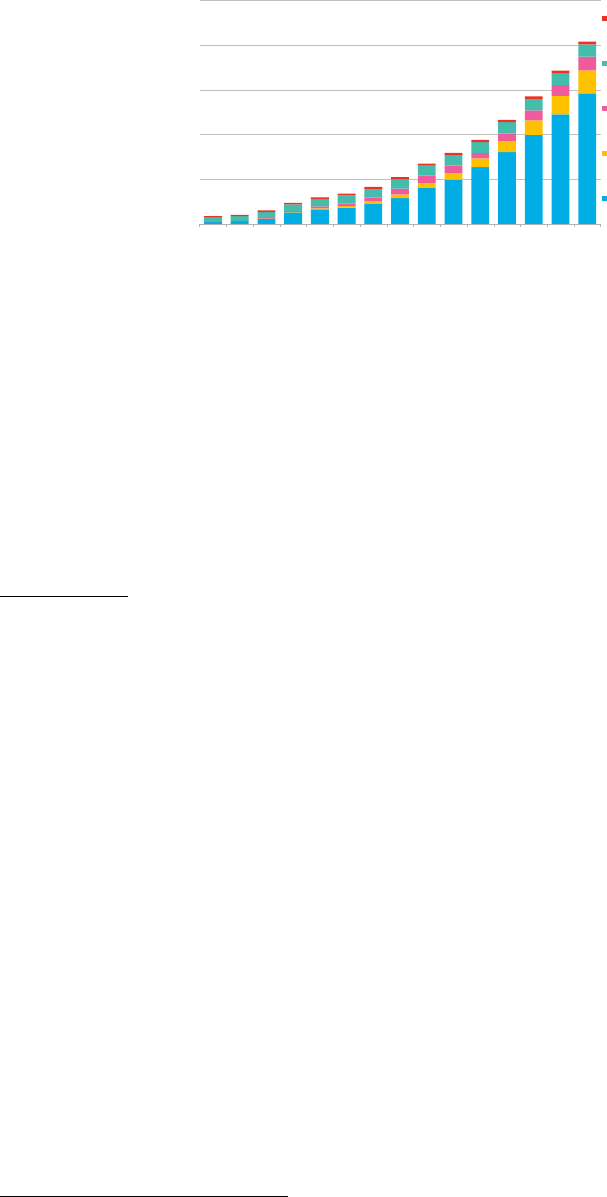
23
Figure 12 Historical and projected annual Li-ion battery demand, by use
Source 12 Bloomberg Long-Term Energy Storage Outlook, 2019: Bloomberg NEF, Avicenne for
consumer electronics
The projected growth, mainly based on electric vehicles (especially passenger vehicles),
comes from the strong technological improvements that are expected and further
decreases in cost. Lithium-ion battery prices, which were above USD 1 100/kWh in
2010, have fallen 87% in real terms to USD 156/kWh in 2020
154
. By 2025, average
prices are expected to be close to USD 100/kWh
155
. As regards performance, lithium-ion
energy density has increased significantly in recent years, tripling since their
commercialisation in 1991
151
. Further potential for optimisation is expected with the new
generation of Li-ion batteries
156
.
Value chain: Figure 14 shows the value chain for batteries together with the EU’s
position in the various segments. EU industry is investing in mining, raw and advanced
materials production and processing (cathode, anode and electrolyte materials), and in
modern cell, pack and battery production. The aim is to become more competitive
through quality, scale and, in particular, sustainability.
Figure 13 Assessment of EU position along the battery value chain, 2019
154
L. Trahey, F.R. Brushetta, N.P. Balsara, G. Cedera, L. Chenga, Y.-M. Chianga, N.T. Hahn, B.J. Ingrama, S.D.
Minteer, J.S. Moore, K.T. Mueller, L.F. Nazar, K.A. Persson, D.J. Siegel, K. Xu, K.R. Zavadil, V. Srinivasan, and
G.W. Crabtree, ‘Energy storage emerging: A perspective from the Joint Center for Energy Storage Research’,
PNAS, 117 (2020) 12550–12557.
155
BNEF 2019 Battery Price Survey
156
Forthcoming JRC (2020) Technology Development Report LCEO: Battery storage.
0
500
1,000
1,500
2,000
2,500
2016 2018 2020 2022 2024 2026 2028 2030
GWh
E-buses
Consumer electronics
Stationary storage
Commercial EVs
Passenger EVs
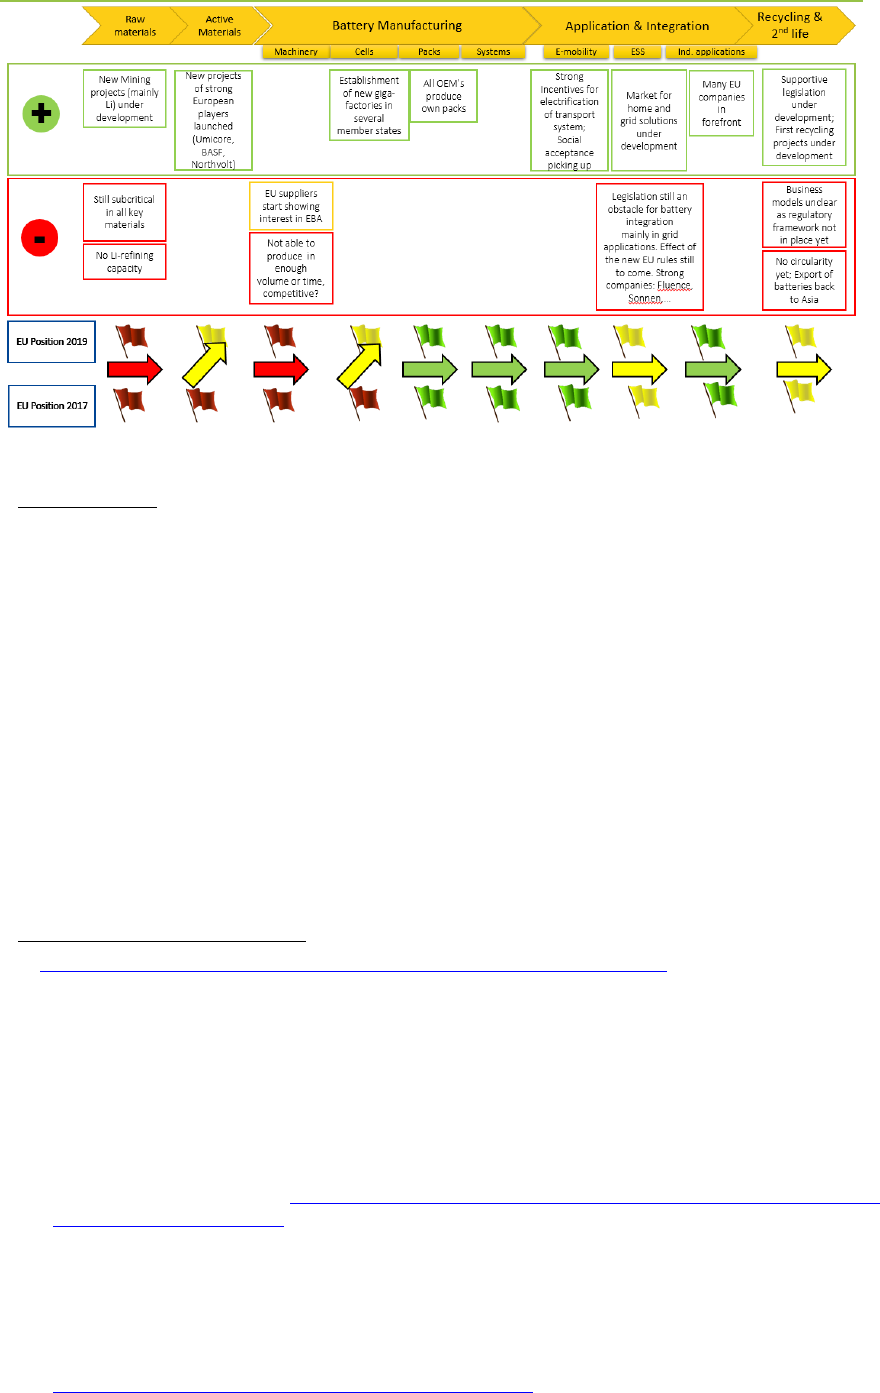
24
Source 13 InnoEnergy (2019).
Global market: the global market for Li-ion batteries for electric cars is currently worth
EUR 15 billion/year (of which the EU accounts for EUR 450 million/year (2017)
157
). A
conservative estimate foresees that the market will be EUR 40-55 billion/year in 2025
and EUR 200 billion/year in 2040
158
. In 2018, the EU had only about 3% of the global
production capacity of Li-ion cells, while China had about 66%
159
. European industry
was perceived as being strong in the downstream, value-driven segments, such as battery
pack manufacturing and integration and battery recycling, and generally weak in
upstream, cost-driven segments such as materials, components and cell
manufacturing
160
,
161
. The marine battery market is growing and estimated to be worth
more than €800 million/year by 2025, more than half within Europe and a technological
sector where Europe currently leads
162
.
Recognising the urgent need for the EU to recover competitiveness in the battery market,
the Commission launched the European Battery Alliance in 2017 and adopted a strategic
action plan for batteries in 2018
163
. This is a comprehensive policy framework with
regulatory and financial instruments to support the establishment of a complete battery
157
https://ec.europa.eu/jrc/sites/jrcsh/files/jrc114616_li-ion_batteries_two-pager_final.pdf
158
Bloomberg Long Term Energy Storage Outlook 2019, p55-56
159
Manufacturing capacity; Bloomberg Long-Term Energy Storage Outlook, 2019, pp. 55-56
160
JRC Science for Policy report: Steen M., Lebedeva N., Di Persio F., Boon-Brett L., EU Competitiveness in
Advanced Li-ion Batteries for E-Mobility and Stationary Storage Applications – Opportunities and Actions, EUR
28837 EN, Publications Office of the European Union, Luxembourg, 2017 doi:10.2760/75757.
161
JRC Science for Policy report: Lebedeva, N., Di Persio, F., Boon-Brett, L., Lithium ion battery value chain and
related opportunities for Europe, EUR 28534 EN, Publications Office of the European Union, Luxembourg, 2016,
doi:10.2760/6060.
162
https://www.marketsandmarkets.com/Market-Reports/marine-battery-market-210222319.html
163
COM 2019 176 Report on the Implementation of the Strategic Action Plan on Batteries: Building a Strategic
Battery Value Chain in Europe. https://ec.europa.eu/transparency/regdoc/rep/1/2019/EN/COM-2019-176-
F1-EN-MAIN-PART-1.PDF
Actions include a) strengthening the Horizon 2020 programme through additional battery research funding, b)
creating a specific technology platform, the ETIP ‘Batteries Europe’ tasked with coordination of R&D&I efforts
at regional, national and European levels, c) preparing specific instruments for the next Research Framework
Programme Horizon Europe, d) preparing new sustainability regulation, and e) stimulating investment through
Important Project of Common European Interest (IPCEI). Press release IP/19/6705, ‘State aid: Commission
approves €3.2 billion public support by seven Member States for a pan-European research and innovation project
in all segments of the battery value chain’, 9 December 2019.
https://ec.europa.eu/commission/presscorner/detail/en/ip_19_6705.

25
value chain ecosystem in Europe. At the same time, large-scale battery and battery cell
manufacturers are starting to establish new production plants (e.g. Northvolt). Currently,
there have been announcements for investments in up to 22 battery factories (some of
which are under construction), with a projected capacity of 500 GWh by 2030
164
.
Figure 14 Li-ion cell manufacturing capacity by region of plant location
Source 14 BloombergNEF, 2019
The EU has strengths which it can build on to catch up in the battery industry,
particularly in advanced materials and battery chemistries, and in recycling, where EU
pioneering legislation has made it possible to develop a well-structured industry. The
Batteries Directive is currently under revision. However, to capture a significant market
share of the new and fast-growing rechargeable battery market, sustained action is
needed over an extended period to ensure more investment in production capacity. This
needs to be supported by R&I to improve the performance of batteries, while also
guaranteeing that they meet EU-level quality and safety standards, as well as to guarantee
the availability of raw and processed materials and the reuse or recycling and
sustainability of the whole battery value chain. There also needs to be a new
comprehensive EU legislative framework that sets out robust standards for performance
and sustainability for batteries placed on the EU market. This will help industry to plan
investments and ensure high standards of sustainability in line with the objectives of the
European Green Deal. A Commission proposal will be adopted shortly.
While improving the position on Li-ion technology is likely to be a core interest stream
over the next few decades, there is also a need to look into other new and promising
battery technologies (such as all-solid state, post Li-ion and redox flow technology).
These are important for applications whose requirements cannot be met by Li-ion
technology.
3.6 Smart electricity grids
Electrification increases in all scenarios for 2050
165
, so a smart electricity system is
essential if the EU is to achieve its Green Deal ambitions. A smart system enables a more
efficient integration of increasing shares of renewable electricity production and of
increasing electricity storage and/or consuming devices (e.g. electric vehicles) in the
164
EBA 2020.
165
‘The share of electricity in final energy demand will at least double, bringing it up to 53%, and electricity
production will increase substantially to achieve net-zero greenhouse gas emissions, up to 2.5 times of today's
levels depending on the options selected for the energy transition’, Communication on ‘A Clean Planet for all - A
European strategic long-term vision for a prosperous, modern, competitive and climate neutral economy’, p. 9.
366
1,207
0
200
400
600
800
1,000
1,200
1,400
2019 2023
GWh
Other
Japan
South Korea
U.S.
Europe
China
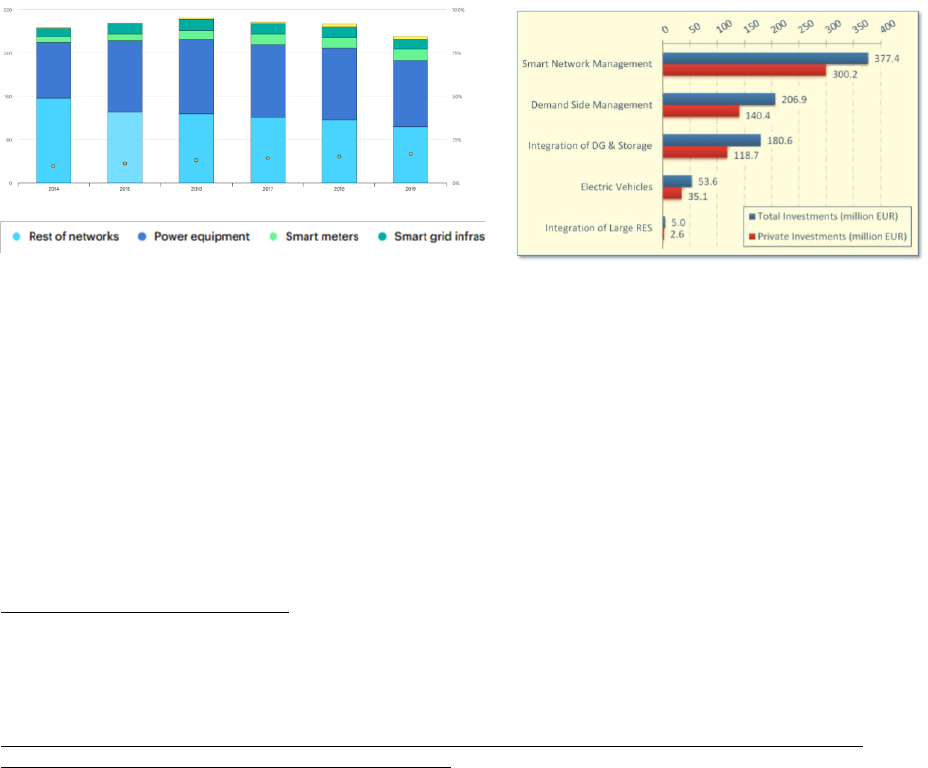
26
energy system. The same applies to the growing numbers of devices that run on
electricity, such as electric vehicles. Through comprehensive control and monitoring of
the grid, smart systems also create value by reducing the need for curtailment of
renewables and enabling competitive and innovative energy services for consumers.
According to the IEA, investment in enhanced digitalisation would reduce curtailment in
Europe by 67 TWh by 2040
166
. In Germany alone, 6.48 TWh was curtailed in 2019,
while grid stabilisation measures cost EUR 1.2 billion
167
. Such systems need to be cyber-
secure, which requires sector-specific measures.
168
Investments in digital grid infrastructure are dominated by hardware such as smart meters
and electric vehicle chargers. In Europe, investments remained stable in 2019 at nearly
EUR 42 billion
169
, with a larger portion of spending allocated to upgrading and
refurbishing the existing infrastructure.
Figure 15 (left) Global investment in smart grids by technology area, 2014-2019
170
(billion USD)
Figure 16 (right) Smart grid investment by European TSOs in recent years, by category (2018)
171
The main source of support for R&I investments in smart grids at EU level is Horizon
2020, which provided almost EUR 1 billion between 2014 and 2020. EUR 100 million
was invested in dedicated digitalisation projects, and many other smart grid projects
assign a considerable proportion of their budget to digitalisation.
172
Figure 16 shows that
public investments in smart grids, including those made through Horizon 2020, account
for a significant share of total investments by transmission system operations (TSOs). It
is noteworthy that budgets for R&I by TSOs are low, at around 0.5% of their annual
budget
173
,
174
.
The TEN-E Regulation also supports investments in smart electricity grids as one of the
12 priority areas, but investments in (cross-border) smart grids could benefit from higher
levels of support from regulatory authorities through inclusion in national network
166
with demand-response accounting for 22 TWh and storage accounting for 45 TWh -
https://www.iea.org/reports/digitalisation-and-energy
167
including costs of curtailment, redispatch and procuring reserve power. These costs are higher in Germany than
elsewhere in Europe, but nevertheless give a good indication of the cost of curtailment. Zahlen zu Netz- und
Systemsicherheitsmaßnahmen - Gesamtjahr 2019, BNetzA,
https://www.bundesnetzagentur.de/DE/Sachgebiete/ElektrizitaetundGas/Unternehmen_Institutionen/Versorgungssicher
heit/Netz_Systemsicherheit/Netz_Systemsicherheit_node.html, p3
168
In particular, real-time requirements (e.g. a circuit breaker must react within a few milliseconds), cascading effects
and the mix of legacy technologies with smart/state of the art technology. See the Commission’s Recommendation
on cybersecurity in the energy sector, C(2019) 2400 final.
169
Source figure is US$ 50bn; https://www.iea.org/reports/tracking-power-2020
170
https://www.iea.org/reports/tracking-energy-integration-2020/smart-grids
171
https://ses.jrc.ec.europa.eu/sites/ses.jrc.ec.europa.eu/files/publications/dsoobservatory2018.pdf
172
Estimated to be at least half of that total Horizon 2020 support for smart grids.
173
This is further supported by figures on sub-markets dealt with in CETTIR (SWD(2020)953), see section 3.17.
174
ENTSO-E RDI Roadmap 2020-2030, July 2020, p. 25.

27
development plans and eligibility for EU financial assistance in the form of grants for
studies and works as well as innovative financial instruments under the Connecting
Europe Facility (CEF). From 2014 to 2019, CEF has provided up to EUR 134 million of
financial assistance related to different smart electricity grids projects across the EU.
The following two key technologies are assessed in more detail: High-voltage direct
current (HVDC) systems, and digital solutions for grid operations and for the integration
of renewables.
i) High-voltage direct current (HVDC) systems
Technology: higher demand for cost-effective solutions to transport electricity over long
distances, particularly, in the EU, to bring power generated by offshore wind to land,
increases demand for HVDC technologies. According to Guidehouse Insights, the
European market for HVDC systems will grow from EUR 1.54 billion in 2020 to EUR
2.74 billion in 2030, at a growth rate
175
of 6.1%
176
,
177
. The global market is expected to
be around EUR 12.5 billion (2020), with the main investments in HVDC taking place in
Asia, where much of the market is taken up by Ultra-HVDC
178
. HVDC equipment is very
costly, and projects to build HVDC connections are therefore very expensive. Given the
technological complexity of HVDC systems, their installation is generally managed by
manufacturers
179
.
Value chain analysis: the value chain for HVDC grids can be segmented along the
different hardware components needed to realise an HVDC connection
180
.
The cost of
HVDC systems is accounted for largely by converters (about 32%) and cables (about
30%)
181
. In the converter stations’ value chain, power electronics
182
play a key role in
determining the efficiency and the size of the equipment. Energy-specific applications
represent only a small part of the global market in electronic components
183
, but offshore
grids and wind turbines depend on their functioning well under offshore conditions. R&I
175
Growth rates in this chapter are reported as compounded annual growth rates (CAGR).
176
Guidehouse Insights (2020) Advanced Transmission & Distribution Technologies Overview. Retrieved at
https://guidehouseinsights.com/reports/advanced-transmission-and-distribution-technologies-overview
177
EU energy models (e.g. Primes) do not model HVDC separately, so no longer-term figures are available. However,
it is clear that the HVDC market is expected to grow consistently, especially given the growth of the offshore
energy market.
178
UHVDC is not used in the EU. It is of particular use in transporting electricity over very long distances, which is
less important in the EU. UHVDC is also less attractive in the EU as permitting is more difficult, for example
because cable towers are higher than normal high-voltage transmission cable towers. The global market for
UHVDC is estimated at EUR 6.5 billion, mostly in China.
179
By way of comparison, turnkey HVAC systems are often delivered by engineering, procurement, and construction
firms.
180
Major converter station components include the transformers, converters, breakers, and power electronics used to
convert power from AC to DC and back again. Line-commutated converters (LCCs), also known as current source
converters (CSCs), and voltage-source converters (VSCs) are the primary commercial HVDC converter
technologies. Both LCC and VSC stations, being more complex than HVAC substations, are also more
expensive
180
. Despite the integration of common technologies, HVDC transformers and converter stations are not
standardised, and designs and costs are highly dependent on local project specifications.
181
In the EU the costs of cables are typically higher: Competitiveness report by ASSET for the European Commission.
182
Power electronics is an essential technology to integrate direct-current (DC) generation and consumption that is
used in many parts of the (future) energy system, such as PV installations, windmills, batteries, and HVDC
converters. Power electronics technology is based on semiconductor technology and allows control of voltage or
current, for example, to manage the grid and convert electricity between AC and DC. It could, therefore, be
addressed in many parts of this report, but because of a specific challenge to do with offshore wind and grids, it is
dealt with here.
183
The total market for power electronics, i.e. passive, active, electromechanical components, was estimated at EUR
316 billion in 2019: Global active electronic components market share, by end user, 2018.
www.grandviewresearch.com

28
investments in HVDC technologies are mainly private. Public funding at EU level
through Horizon 2020 is modest, but has been boosted by the recently finished
Promotion project
184
.
Global market: the global HVDC market is led primarily by three companies, namely
Hitachi ABB Power Grids, Siemens, and GE
185
. Siemens and Hitachi ABB Power Grids
have around 50% of the market in most market segments, whereas cable companies
186
make up around 70% of the market in the EU, and the main competitors are Japanese. In
China, a further vendor, China XD Group, dominates the market.
So far, vendors have sold turnkey systems independently, as they were installed as point-
to-point HVDC connections. In the more interconnected offshore grid of the future,
HVDC systems from different manufacturers will need to be interconnected. This brings
technological challenges to maintaining grid control
187
and, in particular, to ensuring the
interoperability of HVDC equipment and systems. Moreover, as all components need to
be installed on offshore platforms, it is important to reduce their size, and there is a need
to develop power electronic solutions specifically for offshore energy applications.
ii) Digital solutions for grid operations and for the integration of renewables
Technology & value chain: the market for grid management technologies is forecast to
grow very rapidly. The IEA has estimated potential savings from these specific
technologies at almost USD 20 billion globally in cost reduction of operation and
maintenance (O&M) and almost USD 20 billion in avoided network investment
188
. The
market consists of different technologies and services in a value chain that is difficult to
separate clearly, which seem to be integrating as the need increases for integrated
solutions to manage storage, demand response, distributed renewables and the grid itself.
This reports highlights two aspects.
Software- and data-based energy services, which are key to optimising integration of
renewables, including at local level, through remote control of different technologies, in
particular renewables and virtual power plants (VPP)
189
. This is a fast-growing market,
forecast to increase from EUR 200 million (globally
190
) in 2020 to EUR 1 billion in
2030
191
,
192
. It forms the basis of a new industry that provides energy services to energy
businesses (including network operators) as well as to business and household energy
consumers. Thanks to a combination of increase in shares of renewables and market-
supporting policies, Europe has been the driving force behind virtual power plant (VPP)
markets, accounting for nearly 45% of global investments in 2020. Most of this in North-
184
https://www.promotion-offshore.net/
185
Guidehouse Insights (2020) Advanced Transmission & Distribution Technologies Overview. Retrieved at
https://guidehouseinsights.com/reports/advanced-transmission-and-distribution-technologies-overview
186
Prysmian, Nexans, and NKT Cables are the three major European cable companies.
187
Key technologies in this area include grid forming converters and DC circuit breakers.
188
https://www.iea.org/reports/digitalisation-and-energy
189
This includes Distributed energy resources management system (DERMS), Virtual Power Plant (VPP) and DER
Analytics. Please see section 3.17.4 in CETTIR (SWD(2020)953) for a more detailed description.
190
Figures for the EU are unfortunately not available.
191
Competitiveness report by ASSET for the European Commission - Chapter 10.3.2 Grid management (Digital
Technologies)
192
These are considerable markets as is clear when comparing this to more established markets like the EU’s Building
Energy Management System (BEMS) market that has a size of EUR 1.2 billion in 2020 (source: Competitiveness
report by ASSET for the European Commission). In CETTIR (SWD(2020)953) section 3.17.4, this technology is
described together with the Home Energy Management System (HEMS) and the market of energy aggregators.
These markets could also be expected to slowly integrate with the markets described here.
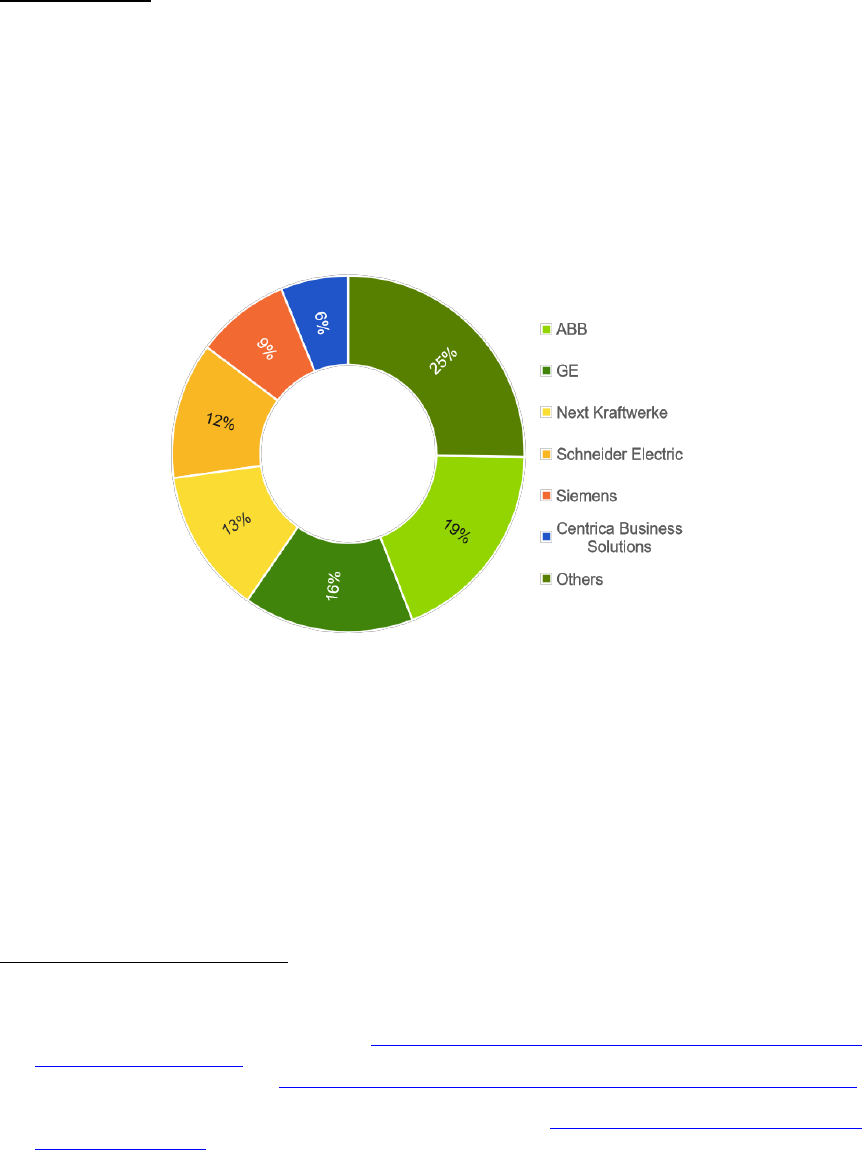
29
West Europe, including the Nordic countries. Within Europe, Germany is forecast to
capture about one-third of the total VPP market’s annual capacity by 2028.
Digital technologies for improved grid operation and maintenance (O&M), which is
a market focused particularly on network operators. This is also a growing market,
expected to reach EUR 0.2 billion in the EU by 2030 for software platforms for
predictive maintenance, and EUR 1.2 billion for Internet-of-Things (IoT) sensors. The
IoT market is expected to grow at 8.8% between 2020 and 2030.
Global market: the EU holds a strong position in both parts. Many of the global
companies are European (Schneider Electric SE and Siemens). Competition is strongest
from US companies, including several innovative start-ups. The Internet-of-Things (IOT)
sensor and monitoring device hardware market consists of several major players with
broad portfolios, and dozens of medium and small companies in niche markets. A
handful of global companies (Hitachi ABB
193
, IBM, Schneider Electric SE, Oracle, GE,
Siemens, and C3.ai) dominate the market for software solutions, which it is hard for new
players to enter. The global market for digital services is shown in figure 17.
Figure 17: Top key market players and market share for digital services, Global, 2020
Source 15 ASSET study on competitiveness
Several oil and gas and other energy providers are making strategic investments in grid
management technologies, in particular services, and have invested in or acquired smaller
startups in the European and US markets. Shell and Eneco have invested in the German
companies Sonnen
194
and Next Kraftwerke respectively
195
and Engie has invested in the
UK’s Kiwi Power
196
. This trend seems to be confirmed by the fact that out of 200 recent
193
The consequences of the divestment of ABB to Hitachi (https://new.abb.com/news/detail/64657/abb-completes-
divestment-of-power-grids-to-hitachi) still need to be analysed further.
194
Shell owns 100% of the shares of Sonnen: https://www.shell.com/media/news-and-media-releases/2019/smart-
energy-storage-systems.html, 15 February 2019.
195
Eneco owns a 34% minority share: https://www.next-kraftwerke.com/news/eneco-group-invests-in-next-kraftwerke,
8 May 2017.
196
Engie owns just under 50% of the shares, but is the largest shareholder: https://theenergyst.com/engie-acquires-dsr-
aggregator-kiwi-power/, 26 November 2018.

30
ventures that oil and gas companies have invested in, 65 were in the area of digitalisation,
being the third sector after upstream conventional ventures and renewables
197
.
While software platforms are reaching maturity, the applications for digital technologies
to provide grid services continue to push innovation in the market space. Data volumes
are relatively small compared to other sectors, so the innovation challenge is not in the
data volumes or the data analysis technologies
198
. It lies in the availability of and access
to different and distributed sources of data for the software providers to be able to
provide integrated solution to their customers. Market-wide interoperable platforms for
easy data access and data exchange are therefore key.
3.7 Further findings on other clean and low carbon energy technologies and
solutions
As described in the accompanying Staff Working Document, the EU holds a strong
competitive position in onshore wind and hydropower technologies. For onshore wind,
the large scale of the market
199
and increasing capacity outside Europe offer promising
prospects to a relatively well positioned EU industry in the wind value chain
200
.
Similarly, for hydropower the importance of the market
201
and the EUs weight in global
exports (48%) are key elements for a competitive industry. Yet, for both technologies, a
key challenge moving forward is focus research to seize the opportunity of
repowering/refurbishment of the oldest installations for increasing their social acceptance
and reduced footprint. For renewable fuels, the key issue is to shift from first
202
to
second and third generation fuels to expand the feedstock sustainability and optimise its
use. To do so, scale up and demonstration projects will be important moving forward.
In the geothermal energy technologies (market of approx. 1 EUR billion) and solar
thermal power technologies (market of approx. EUR 3 billion) markets, in order to
increase the EU’s market share, the challenge is to further deployment in existing and
new heat applications for both buildings (especially for geothermal) and industry
(especially for solar thermal power), and to further advance the innovation potential to
integrate these technologies at scale. The development of Carbon Capture and Storage
(CCS) technologies is currently hampered by the lack of viable business models and
markets. With regard to nuclear energy technologies, EU companies are competitive
across the whole value chain. Current competitiveness focus is set on developing and
constructing on schedule, and on guaranteeing safety for the entire nuclear life cycle,
with special regard to the disposal of the radioactive waste and the decommissioning of
closing plants. Technological innovations such as Small Modular Reactors are being
developed to maintain EU’s competitiveness in the nuclear domain.
A key sector when it comes to reducing energy consumption are buildings, representing
40% of the EU’s energy usage. The EU has a strong position in certain sectors
203
such as
197
The Energy Transition and Oil Companies’ Hard Choices – Oxford Institute for Energy Studies, July 2019; Rob
West, Founder, Thundersaid Energy & Research Associate, OIES and Bassam Fattouh, Director, OIES, p. 6.
198
See CETTIR (SWD(2020)953) section 3.17 for more information.
199
EU wind industry revenues in 2019: EUR 86.1 billion
200
European manufacturers represent around 35%; Chinese manufacturers almost 50%
201
Current EU28 market: EUR 25 billion
202
The EU27 biofuels industry turnover was 14 billion EUR in 2017 – mostly first generation feedstocks.
203
Not all sectors have been covered in this first report due to data availability constraints. Further sectors top be
analysed include the buildings enveloppe and construction techniques/modelling/design.

31
prefabricated building components
204
, district heating systems, heat pump technologies
and home/buildings energy management systems (HEMS/BEMS). In the energy efficient
lighting industry
205
the EU has a long tradition in designing and supplying innovative and
high efficient lighting systems. The competitiveness challenge lies in the large scale mass
production which is possible for the solid state based lighting devices. Asian suppliers
are in a more favourable position because they can scale up to much higher capacity
(economies of scale). Whereas, high skills in innovative design and new approaches are
traditionally part of the European industrial sector.
Lastly, the energy transition is not all about technologies, but also about fitting these
technologies into the system. Succeeding in moving towards net-zero economies and
societies requires placing citizens at the heart of all actions
206
by closely looking into
main motivational factors and strategies to engage them and situating the energy
consumer in a broader social context. The current legal framework at the EU level
represents a clear opportunity for energy consumers and citizens taking the lead and
clearly benefit from the energy transition. On the basis of the observed urbanization
trends, cities can play a key role in developing a holistic and integrated approach
207
to the
energy transition, and its link with other sectors, such as mobility, ICT, and waste or
water management. This, in turn, requires research and innovation in technologies as well
as in processes, knowledge and capacity growth involving city authorities, businesses
and citizens.
CONCLUSIONS
First and foremost, this report shows the economic potential of the clean energy sector.
This outcome is also supported by the recent Impact Assessment of the 2030 Climate
Target Plan
208
. It reinforces the argument how the European Green Deal has a clear
potential to be the EU’s growth strategy through the energy sector. In this analysis,
evidence shows that the clean energy technologies sector is outperforming conventional
energy sources and in comparison is creating more value-added, employment and
productive labour. The clean energy sector is gaining importance in the EU economy, in
line with the increased demand for clean technologies.
At the same time, public and private investments in clean energy R&I are decreasing,
putting at risk the development of key technologies needed to decarbonise the economy
and reach the ambitious objectives of the European Green Deal. This decline would also
have a negative impact on the economic and employment growth observed until now.
Furthermore, the energy sector is not investing much in R&I compared to other sectors,
and within the energy industry, those investing most in R&I are oil and gas companies.
Although there are positive signs, with oil and gas companies increasingly investing in
204
EU 28 production value increased from EUR 31.85 billion (in 2009) to EUR 44.38 billion (in 2018). Within the
same period, EU28 exports to the rest of the world increased from EUR 0.83 billion to EUR 1.88 billion. On the
other hand, imports have been relatively stable around EUR 0.18 billion in 2009 to EUR 0.26 billion in 2018 with
a low of EUR 0.15 billion in 2012-13.
205
The European lighting market is expected to grow from EUR 16,3 billion in 2012 to EUR 19,8 billion in 2020 - CBI
Ministry of Foreign Affairs, Electronic Lighting in the Netherlands, 2014
206
The engagement strategies have to be both individual and community-oriented, aiming not only at providing
economic incentives, but also at changing individual behaviours tapping into non-economic factors, such as by
providing energy consumption feedback appealing to social norms.
207
Including technologies, holistic urban planning, a combination of large-scale public and private investments, and
co-creation between policy makers, economic actors and citizens
208
COM(2020) 562 final.
32
clean energy technologies (e.g. wind, PV, digital), such technologies are still a minor part
of their activities.
This trajectory is not sufficient for the EU to become the first climate-neutral continent
and lead the global clean energy transition. A considerable increase in R&I investment,
both public and private, is needed to keep the EU on its decarbonisation path. The
upcoming investments in economic recovery will provide a particularly good opportunity
for this. At the national level, the Commission will encourage the Member States to
consider setting national targets for investments in R&I to support clean energy
technologies as part of the overall call for increased public R&I investments in climate
ambition. The Commission will also work with private sector to step up their R&I
investments.
Second, the EU’s targets for CO
2
emission reduction, renewables and energy efficiency
have triggered investments in new technologies and innovations that have led to globally
competitive industries. This shows that a strong home market is a key factor in industrial
competitiveness in clean energy technologies and that it will drive investments in R&I.
However, key characteristics of the energy market (in particular the high capital
intensity, long investment cycles, new market dynamics, coupled with a low rate of
return on investment) make it difficult to attract sufficient levels of investment into this
sector, which affects its ability to innovate.
Experience with solar PV manufacturing in the EU shows that a strong home market
alone is not enough. In addition to setting targets to create demand for new technologies,
there need to be policies to support EU industry’s ability to respond to this demand. This
includes the development of industrial-based cooperative platforms for specific
technologies (e.g. on batteries and on hydrogen). Further such actions may be needed for
other technologies, in cooperation with Member States and industry.
Third, specific conclusions can be drawn from the six technologies analysed that are
expected to play an increasing role in the EU’s 2030 and 2050 energy mix. In the solar
photovoltaic industry, considerable market opportunities exist in the segments of the
value chain where specialisation or high performance/high value products are key.
Similarly, for batteries, the EU’s ongoing competitive recovery in the cell manufacturing
segment through initiatives such as the European Batteries Alliance complements the
more established European industry’s position in the downstream, value-driven segments
such as battery pack manufacturing and integration, and battery recycling. Regaining a
competitive edge in both technologies is essential, given their projected demand,
modularity and spillover potential (e.g. integration of PV in buildings, vehicles or other
infrastructure).
In the ocean energy, renewable hydrogen and wind industry, the EU currently holds a
first mover advantage. Nevertheless, the expected, multi-fold increase in the capacity size
of the markets suggests that the industry’s structure will inevitably change: expertise
needs to be pooled across companies, and the Member States and the private sector have
to re-structure and pool their value chains to realise the required economies of scale and
positive spillovers. For instance, the EU’s current leading position on the electrolysers
market, along the whole value chain from component supply to final integration
capability, offers significant spillover potential between batteries, electrolysers and fuel
cells. The announced European Clean Hydrogen Alliance will further strengthen
Europe’s global leadership in this domain. As regards ocean energy, technologies have

33
yet to become commercially viable, and financial support schemes need to be identified
to maintain and expand the EU’s current leading position.
The offshore wind industry, with its established innovative capacity that pushes the
boundaries of the technology (e.g. floating offshore wind farms), needs the perspective of
a growing home market as well as sustained R&I funding to benefit from growth in
global markets. The EU smart grid and HVDC industries are also doing well, and
although a small market compared to wind or solar PV, it is important as it creates value
for everything connected to the grid. Given its regulated nature, governments and
regulators in the EU play a key role in exploiting the benefits of this industry.
Fourth, a move towards the clean technologies also shifts the EU import-dependency
from fossil fuel to increasing use of critical raw materials in energy technologies.
However, their dependency is less direct than it is for the fossil fuel as these materials
have the potential to stay in the economy through re-using and recycling. This can
improve the resilience of clean energy technology supply chains and therewith enhance
EU’s open strategic autonomy. There is a clear need for R&I and investments to design
the clean energy technology components to be more reusable and recyclable, in order for
the materials to be kept in the economy for as long as possible at as a high
value/performance as possible. Related to moving towards further circularity, the EU’s
engagement in international fora such as G20, Clean Energy Ministerial and Mission
Innovation will allow the EU to drive the creation of environmental standards for new
technologies and further strengthen its global leadership, and will mitigate the risk of
supply disruptions, technologies’ sustainability and quality.
Fifth, the European Commission will further develop the competitiveness assessment
methodology in cooperation with the Member States and the stakeholders. The aim is to
improve the macro-economic analysis of the clean energy sector, including the
prerequisite of more data. An improved methodology will support designing an energy
R&I policy helping to create a competitive, dynamic and resilient clean technology
industry. The annual assessment of competitiveness of the clean energy sector will be
complementary with the framework of the National Energy and Climate Plans, the
Strategic Energy Technology Plan and the Clean Energy Industrial Forum. The aim of
the continued and improved assessment is for the clean energy sector to play its full role
in making the European Green Deal, an EU growth strategy in practice.
