
Renewable energy
statistics
Statistics Explained
Source : Statistics Explained (https://ec.europa.eu/eurostat/statisticsexplained/) - 03/01/2024 1
Data extracted in December 2023.
Planned article update: December 2024.
" In 2022, renewable energy represented 23.0 % of energy consumed in the EU, up from 21.9% in 2021. "
" The share of energy from renewable sources used in transport in the EU reached 9.6 % in 2022, up from
9.1% in 2021."
Becoming the world’s first climate-neutral continent by 2050 is the objective behind the European Green Deal (
COM(2019) 640 final ), the very ambitious package of measures that should enable European citizens and
businesses to benefit from sustainable green transition. The use of renewable energy has many potential benefits,
including a reduction in greenhouse gas emissions, the diversification of energy supplies and a reduced
dependency on fossil fuel markets (in particular, oil and gas). The growth of renewable energy sources may also
stimulate employment in the EU, through the creation of jobs in new ’green’ technologies. This article provides
recent statistics on the share of energy from renewable sources overall and in three consumption sectors
(electricity, heating and cooling, and transport) in the European Union (EU) . Renewable energy sources include
wind power, solar power (thermal, photovoltaic and concentrated), hydro power, tidal power, geothermal energy,
ambient heat captured by heat pumps, biofuels and the renewable part of waste .
Share of renewable energy more than doubled between 2004 and 2022
The EU reached a 23.0 % share of its gross final energy consumption from renewable sources in 2022, around 1.1
percentage points (pp) higher than in 2021. EU Directive 2023/2413 on the promotion of the use of energy from
renewable sources has revised upwards the EU’s 2030 renewable energy target from 32% to 42.5% (with an aim to
increase it to 45%). Therefore, EU countries need to intensify their efforts to collectively comply with the new EU
target for 2030, which requires increasing the share of renewable energy sources in the EU’s gross final energy
consumption by almost 20 pp.
Figure 1 shows the latest data available for the share of renewable energies in gross final energy consumption.
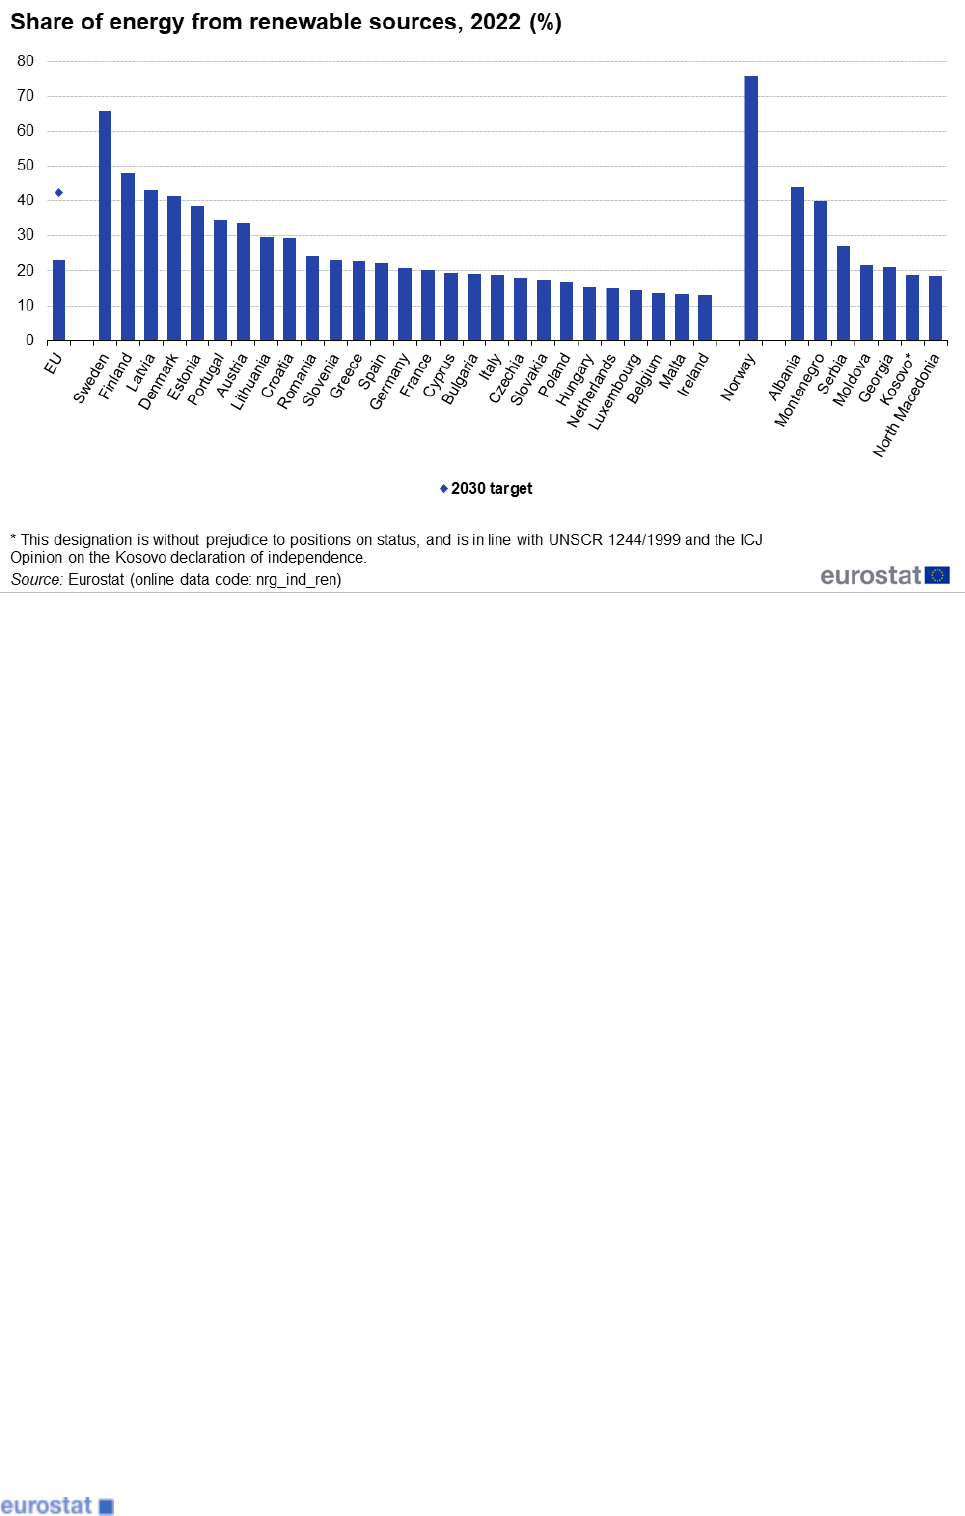
Figure 1: Share of energy from renewable sources, 2022 (% of gross final energy consumption) Source:
Eurostat (nrg_ind_ren)
Sweden leads among EU countries, with nearly two-thirds (66.0 %) of its gross final energy consumption in 2022
derived from renewable sources. Sweden relied primarily on hydro, wind, solid and liquid biofuels, as well as heat
pumps. Finland (47.9 %) followed, also relying on hydro, wind and solid biofuels, ahead of Latvia (43.3 %), which
depended mostly on hydro. Both Denmark (41.6 %), followed by Estonia (38.5 %), got most of the renewables from
wind and solid biofuels. Portugal (34.7 %) relied on solid biofuels, wind, hydro and heat pumps, while Austria (33.8
%) utilised mostly hydro and solid biofuels. The lowest proportions of renewables were recorded in Ireland (13.1
%), Malta (13.4 %), Belgium (13.8 %) and Luxembourg (14.4 %).
Table 1 presents data for all reporting countries.
Renewable energy statistics 2
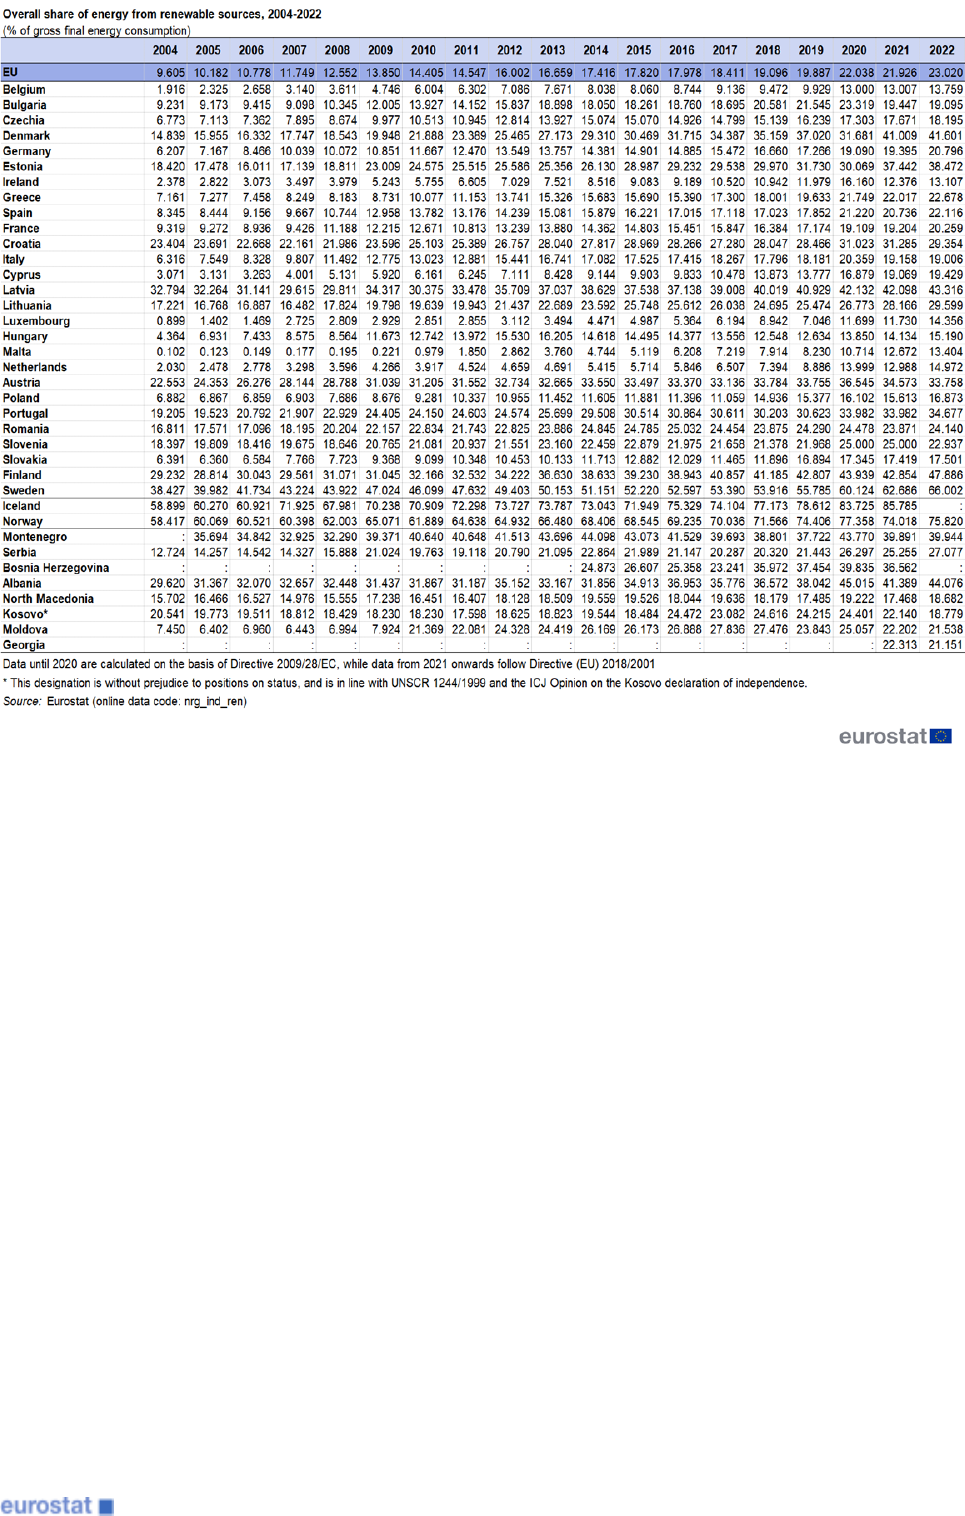
Table 1: Share of energy from renewable sources, 2004-2022 (% of gross final energy consumption) Source:
Eurostat (nrg_ind_ren)
Some countries used statistical transfers to maintain higher levels than their 2020 targets (which is an obligation for
the 2021-2030 period). Statistical transfers are agreements between Member States to transfer a specified amount
of energy from renewable sources from one Member State to another Member States. See Table 1a for more
details on the statistical transfers a reported for reference year 2022.
Renewable energy statistics 3
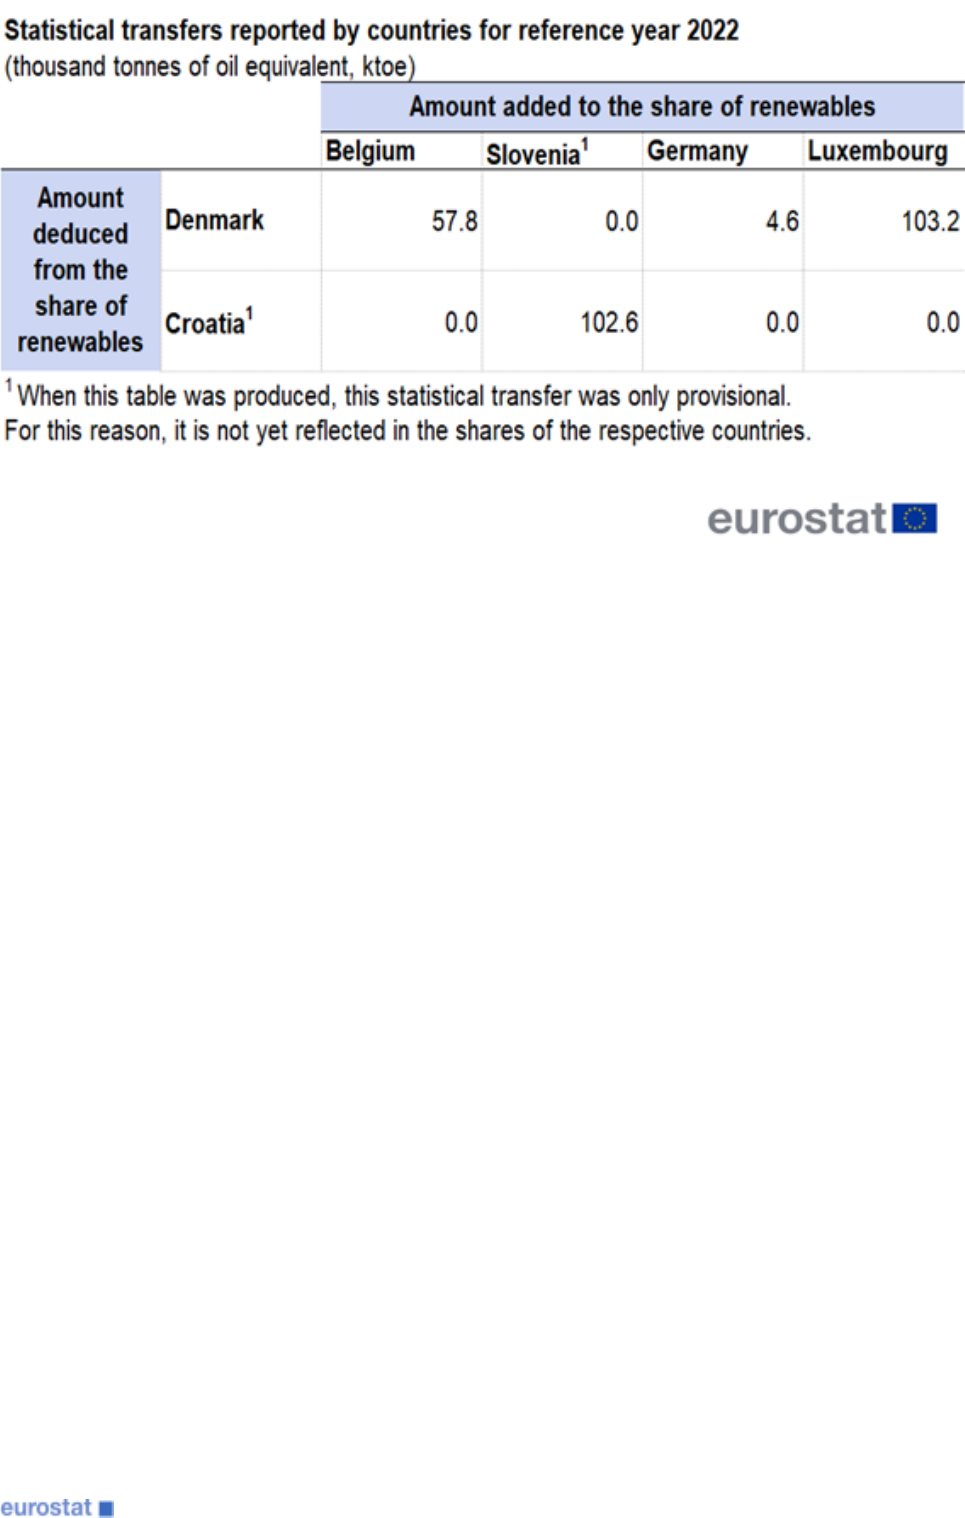
Table 1a: Statistical transfers reported by countries for reference year 2022 (thousand tonnes of oil equiva-
lent) Source: Eurostat (nrg_ind_ren)
The rest of this article’s statistical findings deal with the developments from 2004 to 2022 in the share of energy
from renewable sources in three areas: electricity, heating and cooling, and transport.
Wind and water provide most renewable electricity; solar is the fastest-growing energy
source
The accounting rules in Directive (EU) 2018/2001 prescribe that electricity generated by hydro power and wind
power have to be normalised to account for annual weather variations (hydro is normalised over the last 15 years
and wind over the last 5 years, separating on-shore and off-shore wind normalisation). This article presents the
results applying these accounting rules.
The growth in electricity generated from renewable energy sources during the period 2012 to 2022 largely reflects
an expansion in two renewable energy sources across the EU, namely wind power and solar power. In 2022,
renewable energy sources made up 41.2 % of gross electricity consumption in the EU, almost 4 percentage points
higher than the previous year (37.5 % in 2021).
Wind and hydro power accounted for more than two-thirds of the total electricity generated from renewable sources
(37.5 and 29.9 %, respectively). The remaining one-third of electricity generated was from solar power (18.2 %),
solid biofuels (6.9 %) and other renewable sources (7.5 %). Solar power is the fastest-growing source: in 2008, it
accounted for 1 %. This means that the growth in electricity from solar power has been dramatic, rising from just 7.4
TWh in 2008 to 210.3 TWh in 2022.
The share of energy from renewable sources in electricity is presented in Figure 2.
Renewable energy statistics 4
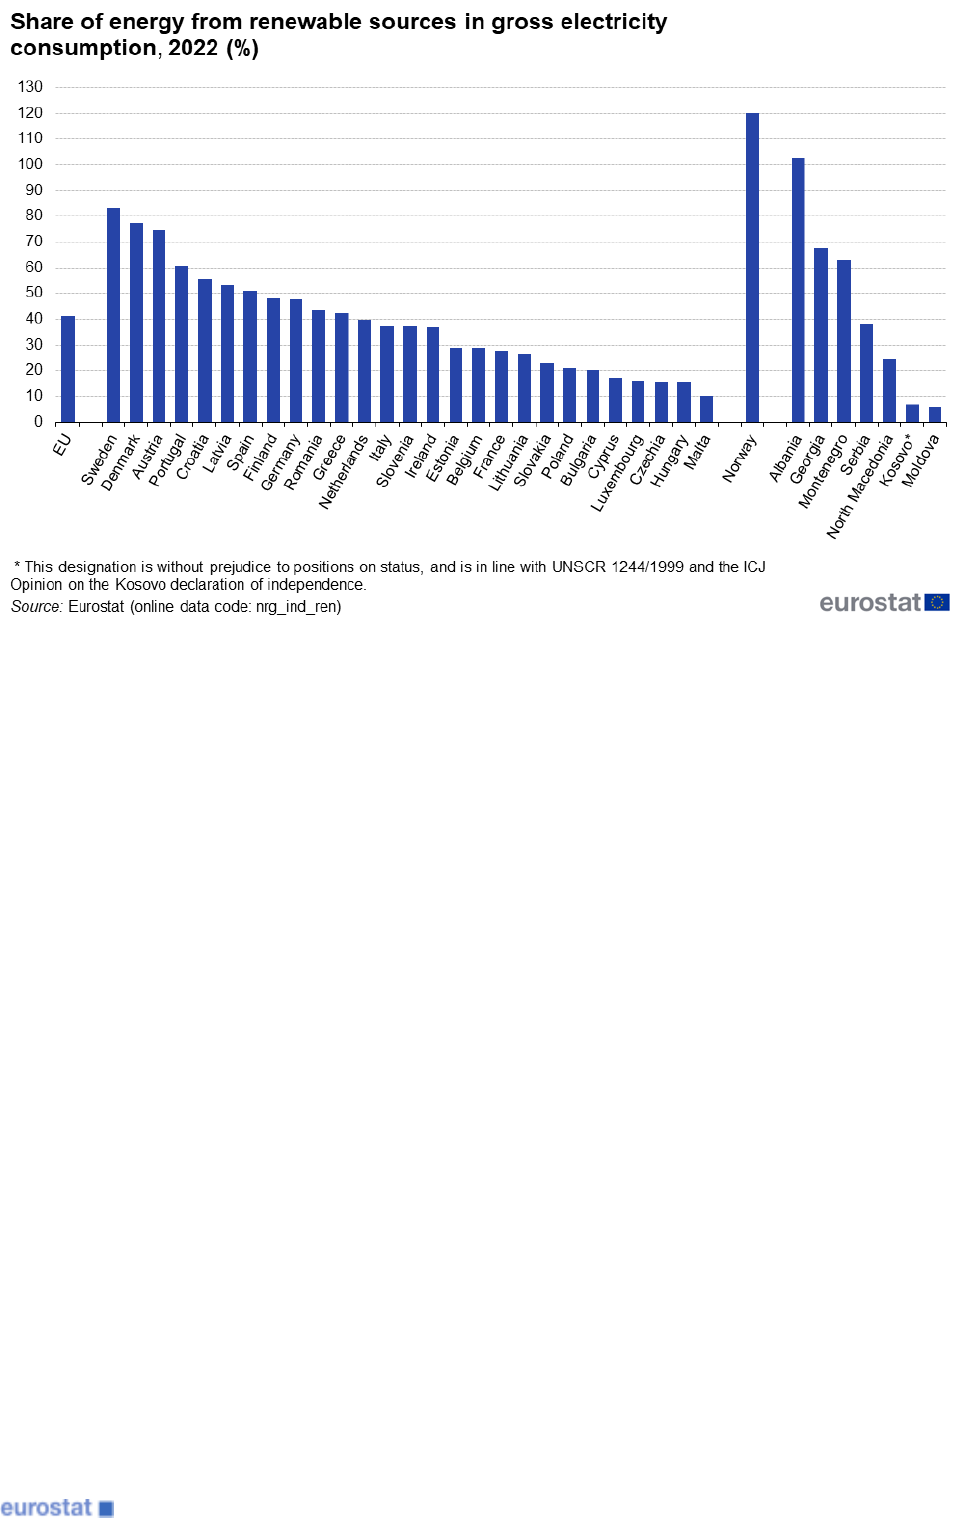
Figure 2: Share of energy from renewable sources in gross electricity consumption, 2022 Source: Eurostat
(nrg_ind_ren)
Among the EU Member States, more than 70 % of electricity consumed in 2020 was generated from renewable
sources in Austria (74.7 %), Denmark (77.2 %) and Sweden (83.3 %). The consumption of electricity from
renewable sources was also high in Portugal (61.0 %), Croatia (55.5 %), Latvia (53.3 %) and Spain (50.9 %),
accounting for more than half of electricity consumed. At the other end of the scale, the share of electricity from
renewable sources was 15 % or less in Malta (10.1 %), Hungary (15.3 %), Czechia (15.5 %), Luxembourg (15.9 %)
and Cyprus (17.0 %). The EFTA country Norway produced more electricity from renewable sources than the total
amount of electricity that it consumed in 2022, therefore leading to a share higher than 100 %.
For more details, see Table 2.
Renewable energy statistics 5
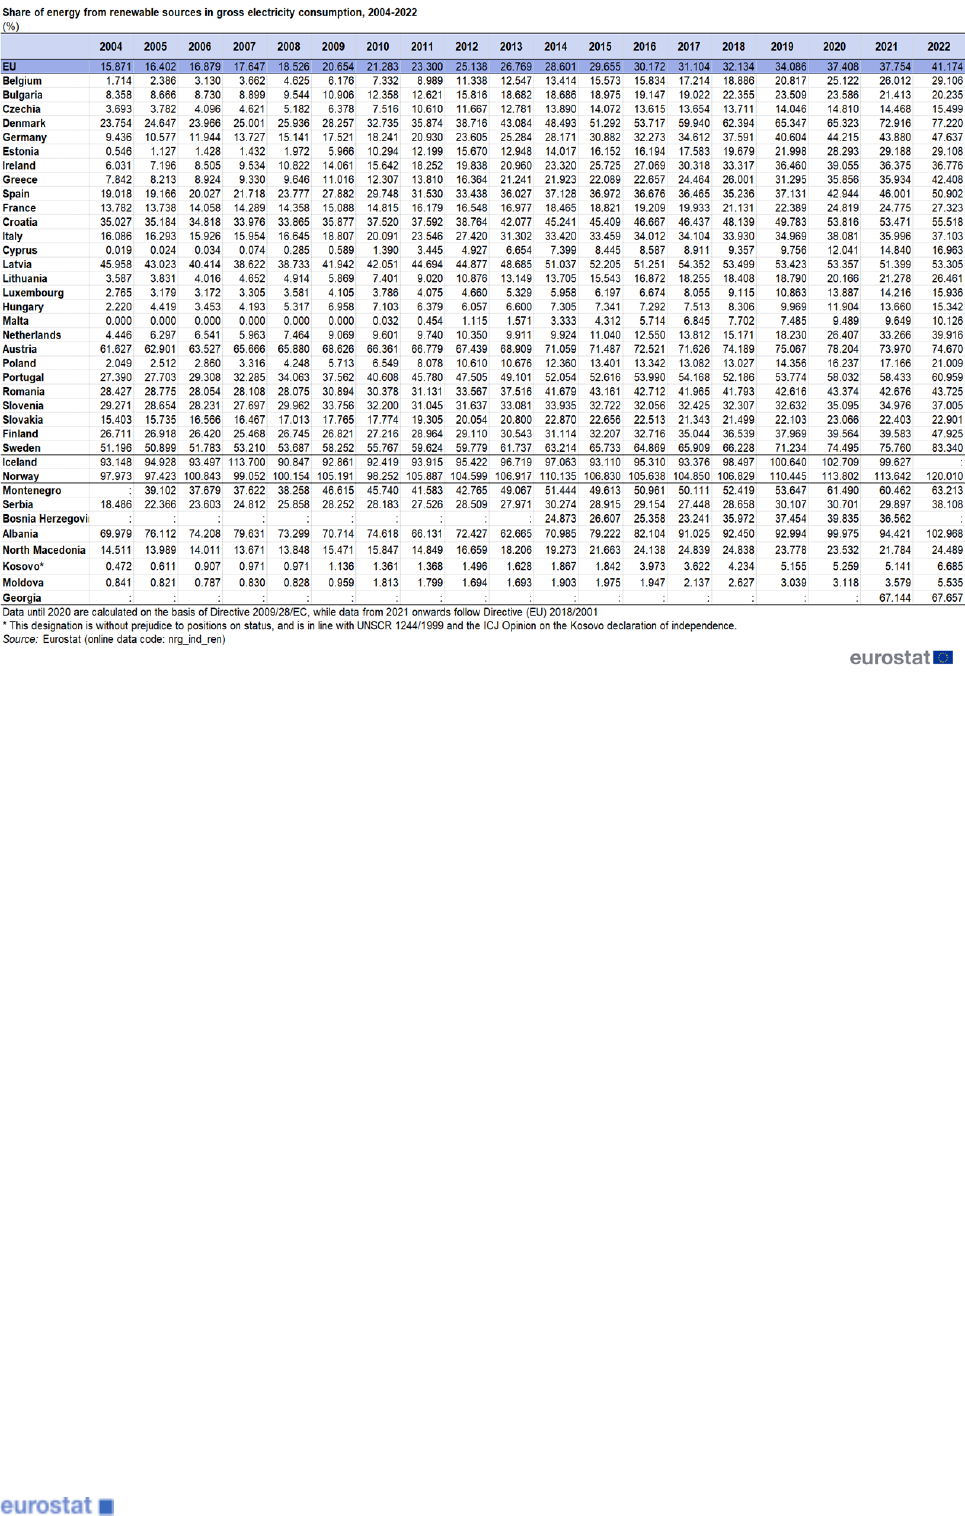
Table 2: Share of energy from renewable sources in gross electricity consumption, 2004-2022 (% of gross
final electricity consumption) Source: Eurostat (nrg_ind_ren)
Almost one quarter of energy used for heating and cooling from renewable sources
In 2022, renewable energy accounted for 24.8 % of total energy use for heating and cooling in the EU, increasing
from 11.7 % in 2004. Developments in the industrial sector, services and households contributed to this growth.
Ambient energy captured by heat pumps for heating and renewable cooling are
also taken into account. The share of energy from renewable sources in heating and cooling is presented in Figure 3.
Renewable energy statistics 6
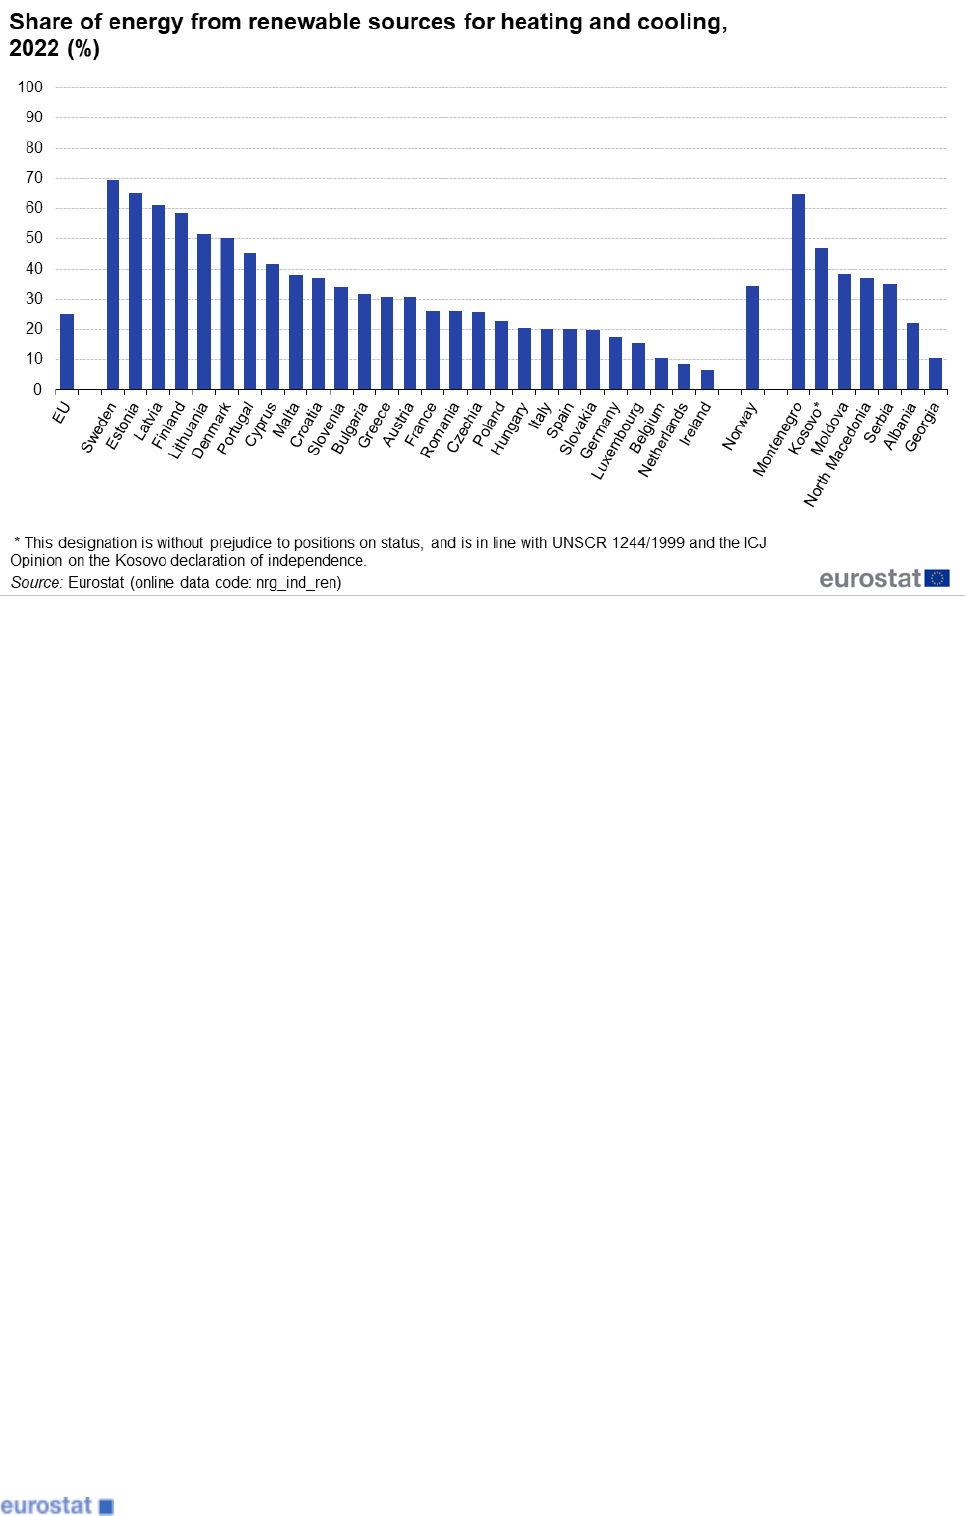
Figure 3: Share of energy from renewable sources for heating and cooling, 2023 Source: Eurostat
(nrg_ind_ren)
Among the EU Member States the share of energy from renewable sources in heating and cooling was more than
half in Sweden (69.4 %), Estonia (65.4 %), Latvia (61.0 %), Finland (58.5 %), Lithuania (51.5 %) and Denmark
(50.1 %). At the other side of the scale, the EU Member States with a share of energy from renewable sources in
heating and cooling of less than 10 % were Ireland (6.3 %) and the Netherlands (8.6 %), see Table 3.
Renewable energy statistics 7
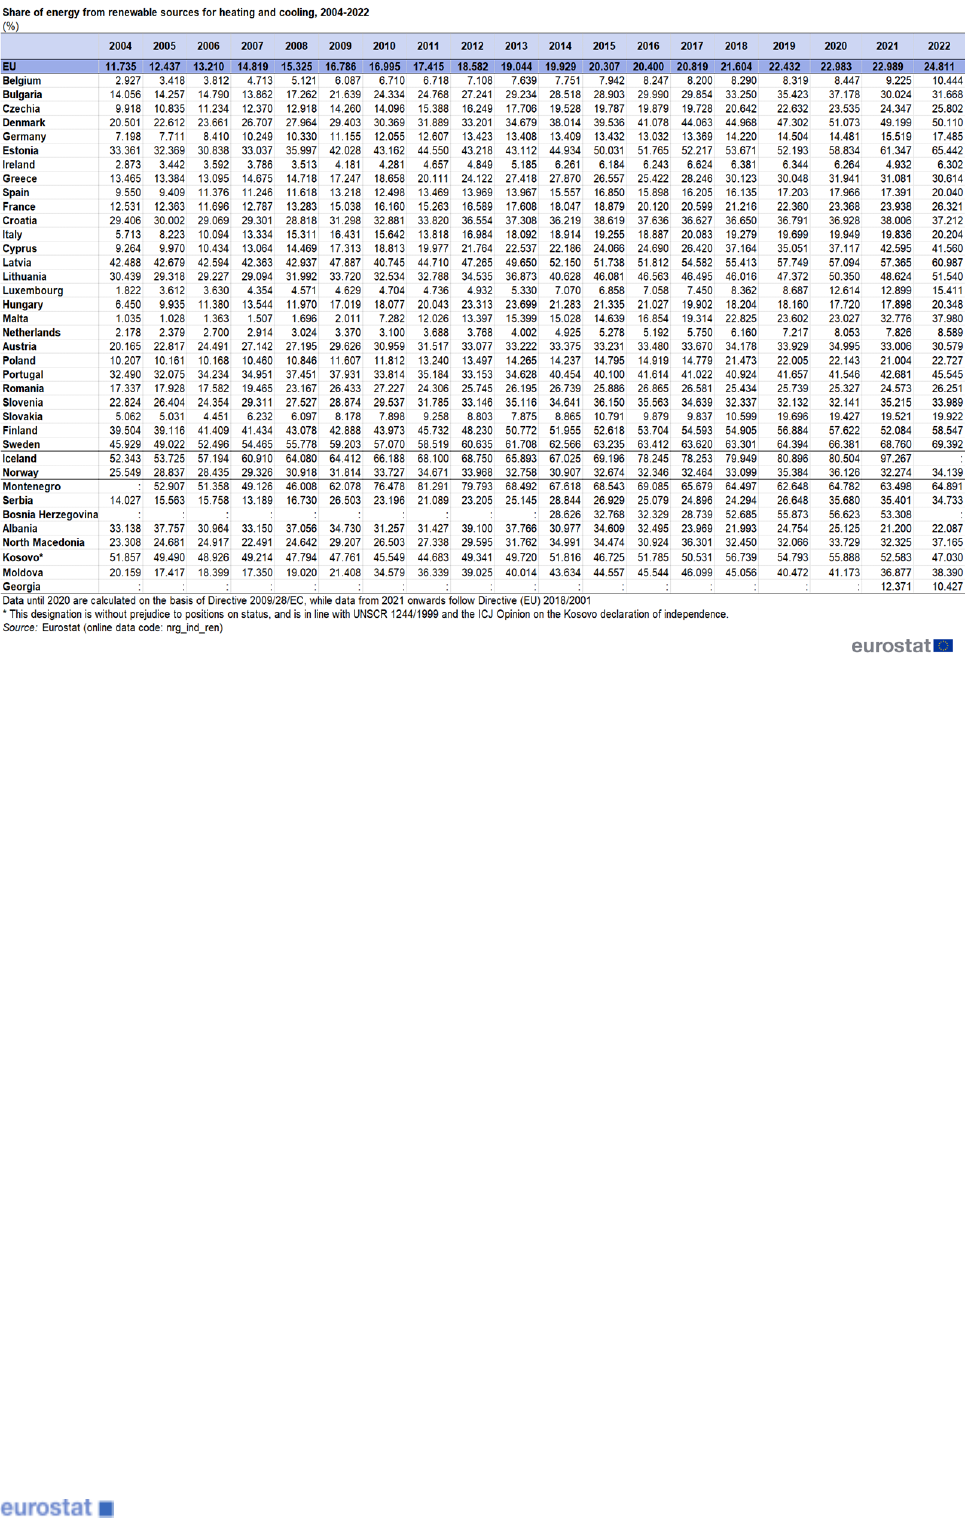
Table 3: Share of energy from renewable sources in heating and cooling, 2004-2022 (%) Source: Eurostat
(nrg_ind_ren)
9.6% of renewable energy used in transport activities in 2021
The EU agreed to set a common target of 29 % for the share of renewable energy (including liquid biofuels,
hydrogen, biomethane, ’green’ electricity, etc.) used in transport by 2030.
The average share of energy from renewable sources in transport increased from 1.6 % in 2004 to 9.6 % in 2022.
Among the EU Member States, the share of renewable energy in transport fuel consumption ranged from highs of
29.2 % in Sweden and 18.8 % in Finland down to less than 5 % in Croatia (2.4 %), Latvia (3.1 %) and Greece (4.1
%). The EFTA country Norway also reported a high share of renewable energy in transport fuel consumption (23.7
%). The share of energy from renewable sources in transport is presented in Figure 4.
Renewable energy statistics 8
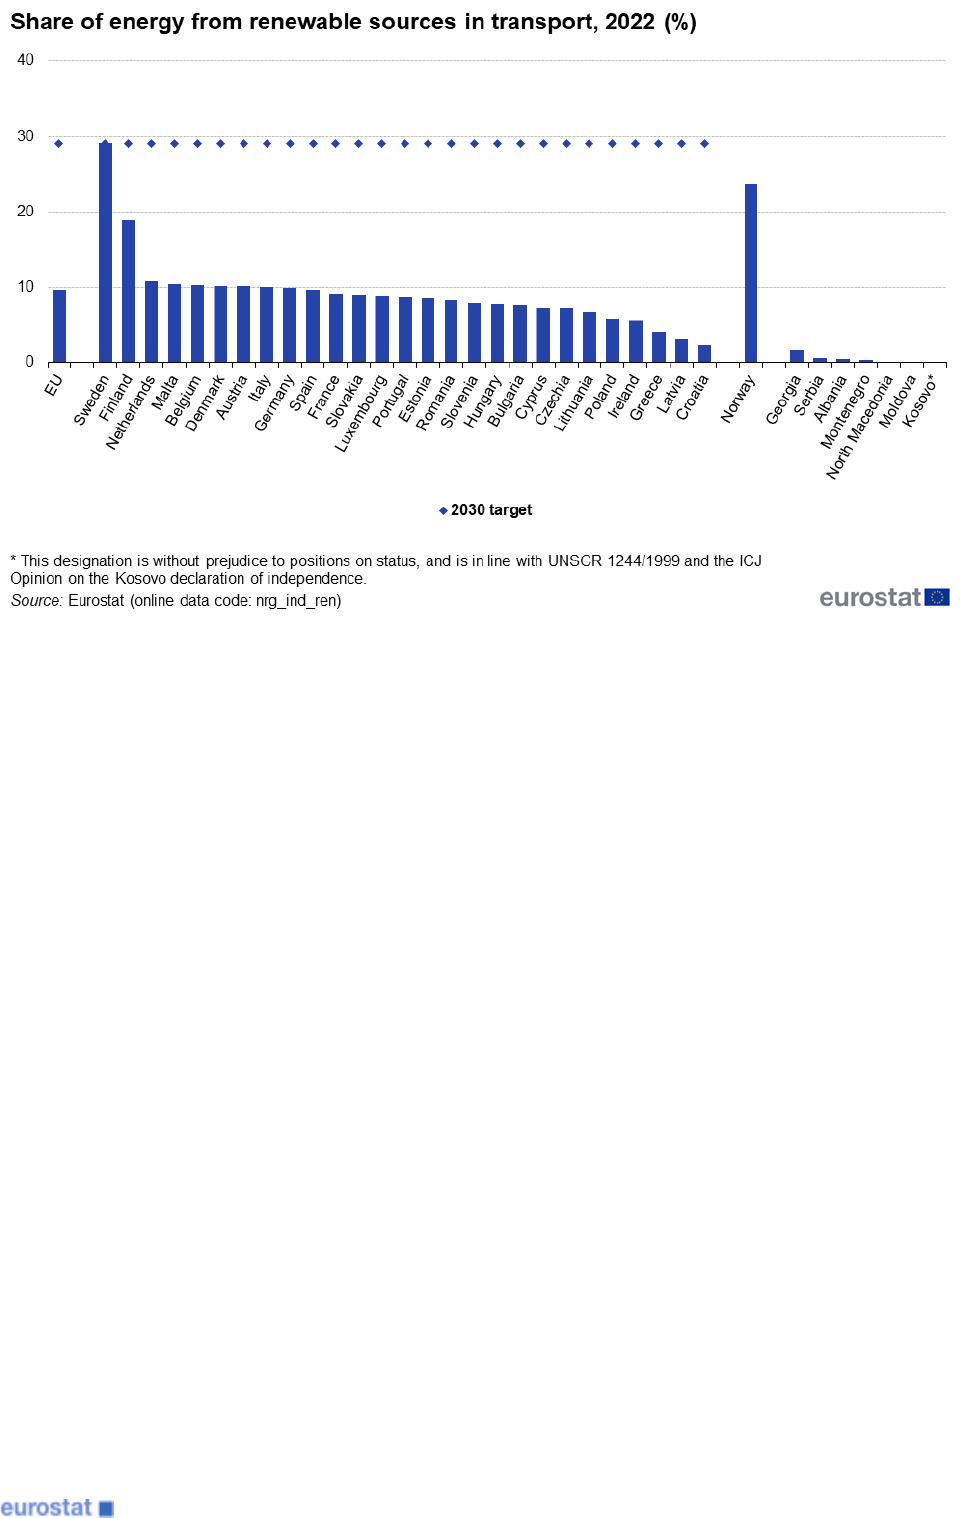
Figure 4: Share of energy from renewable sources in transport, 2022 (% of gross final energy consumption)
Source: Eurostat (nrg_ind_ren)
More details on the share of energy from renewable sources in transport can be found in Table 4.
Renewable energy statistics 9
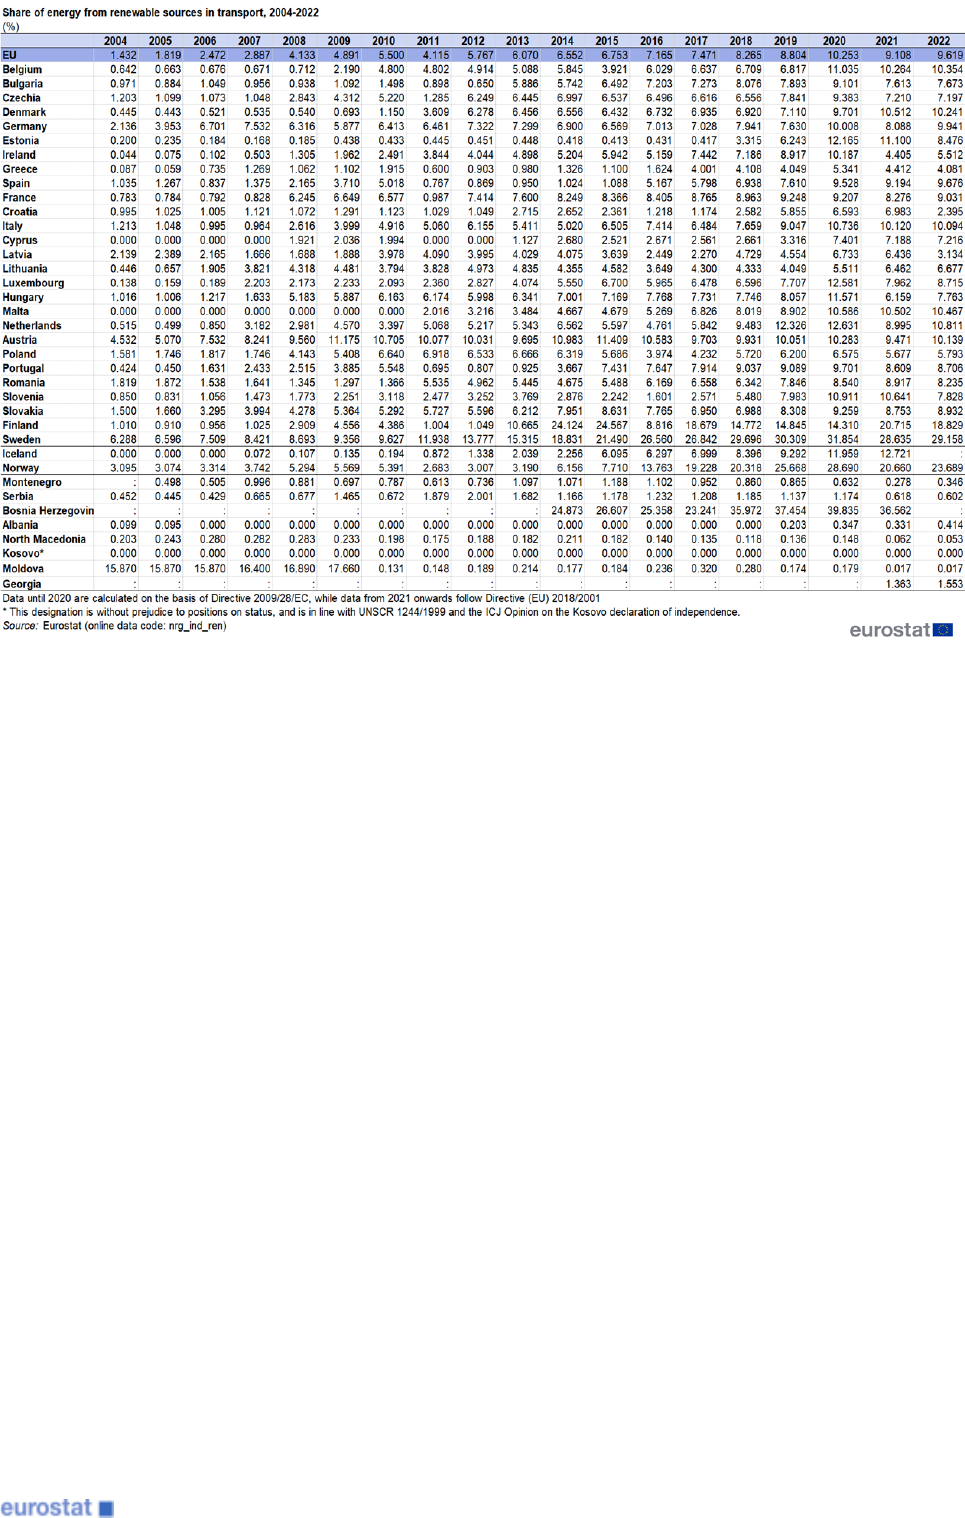
Table 4: Share of energy from renewable sources in transport, 2004-2022 (% of final energy consumption in
transport) Source: Eurostat (nrg_ind_ren)
Source data for tables and graphs
• Renewable energy: tables and figures
Data sources
The data presented in this article are based on energy statistics covered by Regulation (EC) No 1099/2008 on
energy statistics. In addition, the methodology laid down in Directive 2009/28/EC is used until reference year 2020.
From 2021 onwards, the calculation of the share of energy from renewable sources follows the accounting rules set
down in Directive 2018/2001/EU on the promotion of the use of energy from renewable sources. Due to the change
of legal basis, a break in series occurs between 2020 and 2021. Another important aspect to take into account
when comparing 2020 and 2021 data is the lifting of restrictions linked to the COVID-19 pandemic, which produced
an increase of energy consumption and a possible decrease of the share of renewables. Readers are encouraged
to analyse the differences between both Directives (RED I and RED II), the energy sector and all national
specificities before drawing any conclusions from the comparison of year 2021 with previous time series. When the
transposition period for Directive 2023/2413 will finish in 2025, calculations will be adapted to that amendment.
Analysing the break in series between 2020 and 2021, there are some cases in which the share of renewables
substantially changed:
- Bulgaria: more than 6 pp decrease, due to the inability to report a certain part of their solid and gaseous biofuels
as compliant. This might change in the future once they can benefit from a certification procedure.
- Denmark: around 10 pp increase, due to the reduction of their statistical transfers (as seller).
- Estonia : around 7.5 pp increase, mainly because it started to report the use of heat pumps for heating purposes
(which, although already existed, Estonia had not reported it in the past).
Renewable energy statistics 10

- Ireland: more than 3.5 pp decrease, due to their decision not to use statistical transfers in 2021, as well as to the
inability to report a certain part of their solid and gaseous biofuels as compliant.
Data are available for all EU Member States, as well as Norway, Montenegro, Serbia, Albania, North Macedonia,
Kosovo, Georgia and Moldova. In general, data are complete and comparable across countries.
Statistical revisions in data sets submitted by reporting countries in their annual energy questionnaires have played
a role on the change in data over a long period. As a consequence of the Renewable Energy Directive and the
requirement of the Energy Statistics Regulation to report detailed energy consumption data in households,
countries are monitoring much closer the flows of renewable energy commodities in their economies. A very
significant case is the consumption of biomass, where countries are launching new more detailed surveys that
usually result in higher quantities of biomass and therefore an increase of the final energy consumption of biomass.
As a consequence of several countries revising their data, significant increases have been observed in their share
of energy from renewable sources (e.g. Croatia, France, Lithuania, Hungary and recently Poland).
Gross final consumption of energy is defined in the Renewable Energy Directive 2009/28/EC (RED I) as the
energy commodities delivered for energy purposes to industry, transport, households, services (including public
services), agriculture, forestry and fisheries, including the consumption of electricity and heat by the energy branch
for electricity and heat production and including losses of electricity and heat in distribution and transmission. The
concept of transport fuel production is included in the definition in the Renewable Energy Directive (EU) 2018/2001
(RED II), but will disappear with the implementation of amendment.
Energy production from non-renewable municipal wastes was deducted from the contribution of biomass to heating
and electricity generation. Consumption for pipeline transport was included in gross final consumption of energy, in
line with the sectoral classification of the Energy Statistics Regulation. To improve accuracy and consistency with
national statistics in calculating renewable energy shares, national calorific values were used, where available, for
converting quantities of all energy products into energy units, instead of the default calorific values. The exception is
the use of fuels in transport, where calorific values from Annex III of RED I or RED II are used.
Data for the period 2004-2010 : Directive 2009/28/EC did not yet exist or had not been transposed into national
legislation. The values in these years are not used for any measurement of legislative compliance with the
indicative trajectory defined in part B of Annex I of the Directive. The Renewable Energy Directive 2009/28/EC
stipulates that only biofuels and bioliquids that fulfil sustainability criteria should be counted for the targets. It was
decided that for the years 2004-2010 all biofuels and bioliquids would be counted towards the numerator of the
share of energy from renewable sources.
Data for 2011 - 2020 : Compliance with Article 17 (Sustainability criteria for biofuels and bioliquids) has to be
assessed with respect to Article 18 (Verification of compliance with the sustainability criteria for biofuels and
bioliquids). As of reference year 2011, countries are to report as compliant only those biofuels and bioliquids for
which compliance with both Article 17 and Article 18 can be fully demonstrated. Only reported compliant biofuels
and bioliquids are counted towards the respective shares of renewables. In some countries consumption of biofuels
and bioliquids in the period 2011-2015 were not certified as compliant (sustainable) due to late implementation of
Directive 2009/28/EC. While the share of renewable energy as a whole is increasing since 2004, between 2010 and
2011 its share in transport decreased. This can be attributed in part to the total absence of compliant biofuels
reported by several EU countries (countries did report some biofuel use, but none or very little of it compliant in
2011). As some countries had not yet fully implemented all provisions of the Renewable Energy Directive, some
biofuels and bioliquids were not counted as compliant (sustainable) in the period 2011-2015.
Data for 2021 and onwards : Compliance with Article 29 (’Sustainability and greenhouse gas emissions saving
criteria for biofuels, bioliquids and biomass fuels’) has to be judged also with respect to Article 30 (’Verification of
compliance with the sustainability and greenhouse gas emissions saving criteria’). As of data from the second half
of 2021, countries should report as compliant only those biofuels, bioliquids and biomass fuels for which
compliance with Articles 29 and 30 can be fully demonstrated. Otherwise (even when compliance cannot be
demonstrated because there is not a national legal basis in place), biofuels, bioliquids and biomass fuels should not
be reported as compliant and do not count towards the numerator of the share of energy from renewable sources.
The share of electricity from renewable energy sources is defined as the ratio between electricity produced from
renewable energy sources and gross national electricity consumption. As stipulated in the Renewable Energy
Directive 2009/28/EC, gross final consumption of electricity from renewable sources is the electricity produced
from renewable energy sources. This includes hydro power plants (excluding hydro power electricity produced from
Renewable energy statistics 11

pumped storage plants using water previously pumped uphill), as well as electricity generated from solid
biofuels/wastes, wind, solar and geothermal installations. The Directive also requires electricity production from
hydro power and wind power to be normalised. Given the 15-year normalisation requirement for hydro power
production and the availability of energy statistics (for the EU, starting from 1990), time series of this indicator
before 2004 are not available.
For the purpose of calculating the share of renewable energy in heating and cooling , final consumption of
energy from renewable sources is defined as the final consumption of renewable energy in industry, households,
services, agriculture, forestry and fisheries for heating and cooling purposes, plus district heating produced from
renewables. The total final consumption for heating and cooling is the final consumption of all energy commodities,
except electricity, for purposes other than transport, plus the consumption of heat for own use at electricity and heat
plants and heat losses in networks. For more detailed definition, please see SHARES tool manual .
Context
Becoming the world’s first climate-neutral continent by 2050 is the greatest challenge and opportunity of our times.
To achieve this, on 11 December 2019 the European Commission presented the European Green Deal (
COM(2019) 640 final ), the most ambitious package of measures that should enable European citizens and
businesses to benefit from a sustainable green transition. Measures accompanied with an initial roadmap of key
policies range from ambitiously cutting emissions, to investing in cutting-edge research and innovation, to
preserving Europe’s natural environment. Above all, the European Green Deal sets a path for a transition that is
just and socially fair. It is designed in such a way as to leave no individual or region behind in the great
transformation ahead.
The Green Deal is an integral part of the Commission’s strategy to implement the United Nation’s 2030 Agenda and
the sustainable development goals, and the other priorities announced in President von der Leyen’s political
guidelines. As part of the Green Deal, the Commission will refocus the European Semester process of
macroeconomic coordination to integrate the United Nations’ sustainable development goals, to put sustainability
and the well-being of citizens at the centre of economic policy, and the sustainable development goals at the heart
of the EU’s policymaking and action. The European Commission has set out several energy strategies for a more
secure, sustainable and low-carbon economy. Aside from combating climate change through a reduction in
greenhouse gas emissions, the use of renewable energy sources is likely to result in more secure and diverse
energy supply, less air pollution, as well as job creation in environmental and renewable energy sectors.
Building on the 20% target for 2020, on 11 December 2018, the EU adopted Directive 2018/2001/EU on the
promotion of the use of energy from renewable sources, whose last amendment by Directive (EU) 2023/2413
includes a binding renewable energy target for the EU for 2030 of 42.5 % with the aim to achieve 45 %.
On 18 May 2022, the Commission published the REPowerEU plan, which sets out a series of measures to rapidly
reduce EU’s dependence on Russian fossil fuels well before 2030 by accelerating the clean energy transition. The
REPowerEU plan is based on three pillars: saving energy, producing clean energy and diversifying the EU’s energy
supplies.
Other articles
• Calculation methodologies for the share of renewables in energy consumption
• Energy statistics introduced
• Energy statistics - an overview
• Electricity production, consumption and market overview
Renewable energy statistics 12

• Energy production and imports
Publications
• Shedding light on energy in the EU - A guided tour of energy statistics (2022 edition)
• Sustainable development in the European Union — Monitoring report on progress towards the SDGs in an
EU context (2023 edition)
Main tables
• Energy - selected datasets (t_nrg) , see:
Energy statistics - main indicators (t_nrg_ind)
Energy statistics - quantities (t_nrg_quant)
Database
• Energy - detailed datasets (nrg) , see:
Energy statistics - quantities, annual data (nrg_quanta)
Dedicated section
• Energy
Methodology
• Energy Statistics Manual
• Energy statistics — quantities (ESMS metadata file — nrg_quant_esms)
• Share of energy from renewable sources (nrg_ind_share) (ESMS metadata file — nrg_ind_share_esmsip2)
External links
• EURObserv’ER
• European Commission — Directorate-General for Energy — Renewable energy
• Europe’s Energy Portal
• International Renewable Energy Agency
• International Energy Agency (IEA) — Renewable integration
• Concerted Action on Renewable Energy Sources Directive
*This designation is without prejudice to positions on status, and is in line with UNSCR 1244/1999 and the ICJ
Opinion on the Kosovo declaration of independence.
Renewable energy statistics 13
