Eionet Report - ETC/CME 2019/8
Renewable energy in Europe — 2019
Recent growth and knock-on effects
Authors: Filippo Capizzi (Vito), Anjana Das (Vito), Tom Dauwe (Vito), Ils Moorkens (Vito), Risto Juhana
Saarikivi (CHMI) and Mihai Tomescu (EEA)
ETC/CME consortium partners: AETHER, Interprofessional Technical Centre for Studies on Air
Pollution (CITEPA), Czech Hydrometeorological Institute (CHMI), Energy and Environmental
Studies and Software Development (EMISIA), Institute for Applied Ecology (ÖKO-INSTITUT),
ÖKO-RECHERCHE, Norwegian Institute for Air Research (NILU), Netherlands Environmental
Assessment Agency (PBL), National Institute for Public Health and the Environment (RIVM),
Environment Agency Austria (UBA), Flemish Institute for Technological Research (VITO)

Eionet Report - ETC/CME 2019/8
Legal notice
The contents of this publication do not necessarily reflect the official opinions of the European Commission or other institutions
of the European Union. Neither the European Environment Agency, the European Topic Centre on Climate change mitigation and
energy nor any person or company acting on behalf of the Agency or the Topic Centre is responsible for the use that may be made
of the information contained in this report.
Copyright notice
© European Topic Centre on Climate Change Mitigation and Energy (2019)
Reproduction is authorized provided the source is acknowledged.
More information on the European Union is available on the Internet (http://europa.eu).
European Topic Centre on Climate
change mitigation and energy
Boeretang 200
B-2400 Mol, Belgium
Tel.: +32 14 33 59 77
Email: [email protected]
Eionet Report - ETC/CME 2019/8
Contents
1 Introduction.............................................................................................................................................. 6
1.1 Background: international and European context ........................................................................ 6
1.2 About this report ........................................................................................................................... 8
1.2.1 Geographical scope.............................................................................................................. 9
1.2.2 Data sources and methodologies ........................................................................................ 9
2 Developments in renewable energy sources in Europe ......................................................................... 12
2.1 Recent progress in deployment of renewable energy sources ................................................... 13
2.1.1 Renewable energy shares at the EU level and in individual Member States .................... 13
2.1.2 Renewable electricity capacities per capita and per unit of gross domestic product ....... 14
2.2 Contributions of renewable energy sources by energy market sector and technology ............. 16
2.2.1 Contribution of renewable energy sources to various energy market sectors in Member
States 16
2.2.2 Renewable electricity ........................................................................................................ 17
2.2.3 Renewable heating and cooling......................................................................................... 27
2.2.4 Renewable transport fuels ................................................................................................ 31
3 Impacts on fossil fuel consumption, greenhouse gas emissions and air pollutant emissions ............... 35
3.1 Avoided fossil fuel use ................................................................................................................. 36
3.1.1 Effects at the EU level ........................................................................................................ 36
3.1.2 Effects at the Member State level ..................................................................................... 38
3.2 Gross avoided greenhouse gas emissions ................................................................................... 38
3.2.1 Effects at the EU level ........................................................................................................ 38
3.2.2 Effects at Member State level ........................................................................................... 41
3.3 Statistical impacts of renewable energy sources on primary energy consumption ................... 43
3.3.1 Effects at EU level .............................................................................................................. 43
3.3.2 Effects at Member State level ........................................................................................... 44
3.4 Gross effect on air pollutant emissions ....................................................................................... 45
3.4.1 Effects at EU level .............................................................................................................. 45
3.4.2 Effects at Member State level ........................................................................................... 46
3.5 Indirect effects by renewable energy technology ....................................................................... 52
4 EU developments in renewable energy sources in a global perspective ............................................... 56
4.1 Renewable electricity capacities by region and main source ..................................................... 57
4.1.1 Renewable electricity development by region .................................................................. 57
4.1.2 Wind and solar photovoltaic capacity deployment ........................................................... 61
4.2 Renewable energy investments .................................................................................................. 64
4.2.1 Share in global renewable energy investments................................................................. 65
Eionet Report - ETC/CME 2019/8
4.2.2 Growth in renewable energy investments ........................................................................ 66
4.2.3 Total new investments by technology ............................................................................... 68
4.3 Renewable energy employment ................................................................................................. 69
5 Glossary and abbreviations .................................................................................................................... 71
6 References .............................................................................................................................................. 74
Annex 1 Effects of renewable energy on GHG emissions and energy consumption ............................ 78
Annex 2 Effects of renewable energy on air pollutant emissions ......................................................... 80
Annex 3 Methodology and data sources for calculating approximated RES shares ............................. 82
Annex 4 Discussion of main 2017/2018 changes by sector and country .............................................. 83
Eionet Report - ETC/CME 2019/8
Acknowledgements
This report was prepared by the European Environment Agency (EEA) and its European Topic Centre on
Climate change Mitigation and Energy (ETC/CME). The ETC/CME is a consortium of European institutes
assisting the EEA to support European Union (EU) policy in the field of air pollution and climate change
mitigation.
Mihai Tomescu (EEA) and Ils Moorkens (ETC/CME) ensured the coordination of this report.
The authors were, in alphabetical order, Filippo Capizzi (Vito), Anjana Das (Vito), Tom Dauwe (Vito), Ils
Moorkens (Vito), Risto Juhana Saarikivi (CHMI) and Mihai Tomescu (EEA).
The project coordinators would like to thank Adrian Whiteman, from the International Renewable Energy
Agency (IRENA), for his cooperation and for the global data sets concerning renewable energy. We also
wish to thank Eurostat for allowing us to use the SHARES questionnaire templates to calculate and compile
the early renewable energy sources estimates (2018 RES proxies) and especially Marek Sturc (Eurostat) for
the support received for converting the methodology to the format of the new energy balances. We are
also grateful to Dr Wolfgang Schöpp and to Dr Janusz Cofala (IIASA) for the provision of the detailed GAINS
data and for their help in understanding the data.
The EEA would like to thank the national focal points and experts of the EEA member countries for their
cooperation and support during the preparation of this report. The EEA also acknowledges the comments
and suggestions received from experts from the European Commission and its Joint Research Centre and
wishes to thank them for their collaboration.

Eionet Report - ETC/CME 2019/8 1
Executive summary
This report outlines the progress made in 2017 in the deployment of renewable energy sources (RES) in
the European Union (EU) as a whole, and at country, market and technology level.
The results confirm that the EU RES share has remained in line with the indicative trajectory designed to
achieve the mandatory EU RES targets for 2020: a 20 % RES share in energy consumption and the sub-
target of 10 % RES for transport. However, to achieve these objectives with certainty, further efforts to
deploy renewable energy sources across the EU are needed, in particular given the rebound in final energy
consumption in some EU Member States in recent years.
The additional consumption of renewable energy sources throughout Europe since 2005, has had a
number of side benefits: it enabled the EU to reduce its demand for fossil fuels
1
with more than 12 % and
the associated greenhouse gas emissions (GHG) with 10 %, than if renewable energy sources had remained
at the same level as in 2005. For the effect on air pollutant emissions, the outcomes are mixed: the
additional consumption of RES since 2005 led to decreases in the emissions of NO
x
and SO
2
, but to
increases in the emissions of PM
10
, PM
2,5
and VOCs, mainly due to the combustion of biomass.
Besides calculations based on RES consumption data reported by Member States, the report also provides
early estimates from the European Environment Agency (EEA) for all these developments in 2018.
In the final part, the global perspective is taken into account. It indicates that the EU transformed its energy
production base between 2005 and 2017 at a speed which surpassed that of other world regions. Although
the EU is still the world leader in sustainable energy capacity per capita, it was surpassed by China in terms
of total installed capacity since 2013.
The renewable energy share has been continuously increasing at EU level
RES are a major contributor to the transition of Europe’s energy sector. The rapid development of some
renewable energy technologies has already allowed these technologies to achieve high market shares.
Today, for solar photovoltaic (PV) electricity, biogas electricity and solid biomass used for heating and
cooling, these shares are above, or close to, the 2020 levels anticipated by countries in their national
renewable energy action plans (NREAPs), drafted in 2010. This has led to GHG emission reductions in the
EU electricity sector, in the consumption of energy for heating and cooling, and, to a lesser extent, in
transport.
Recent increases in final energy consumption in some Member States are slowing down the pace of
growth of the RES share across the EU
The EU-wide share of renewable energy in gross final EU energy use increased from 17.5 % in 2017 to an
expected 18.0 % in 2018, according to the EEA’s early estimates. Accordingly, the EU has met its indicative
trajectory for 2017-2018 as set out in the Renewable Energy Directive (RED). However, the average yearly
growth in the RES share slowed down in recent years, compared with the average annual pace of growth
recorded between 2005 and 2015. As shown elsewhere (EEA 2019), the slower RES progress in recent
years can largely be attributed to increasing energy consumption across Europe. Although installed
renewable capacity has continued to grow, the pace of growth has slowed down as more energy from
non-renewable sources is consumed. For the period 2015-2017, increases in final energy consumption
from all sources have led to a reversal in progress towards national and EU energy efficiency objectives for
2020. In 2018, preliminary estimates of the EEA show that final energy consumption increased again by
0.1 % compared with 2017, marking the fourth consecutive year of final energy consumption increases.
1
Primary fossil fuel consumption
Eionet Report - ETC/CME 2019/8 2
Today, the RES shares continue to vary widely between countries, ranging from over 30 % of gross final
energy consumption in countries such as Austria, Denmark, Finland, Latvia and Sweden to 10 % or less, in
Belgium, Cyprus, Luxembourg, Malta, and the Netherlands.
Renewable energy sources are mostly used for heating and cooling; in transport they are lagging behind
In absolute terms, renewable energy for heating and cooling remains the dominant RES market sector in
Europe. RES made up close to one fifth of all final energy consumed for heating and cooling: 19.5 % in 2017
and 19.8 % in 2018, according to reported data and early EEA estimates. Since 2005, despite biogas and
heat pumps having faster percentage points increases on average per year, solid biomass-based
technologies prevailed in this market sector.
In absolute terms, renewable electricity is the second largest RES market sector in the EU. Growth in this
sector was driven especially by growth in onshore and offshore wind power and solar PV electricity
generation, but also by other RES, such as an increase in solid biomass combustion for electricity purposes.
More than 30 % of all electricity consumed in the EU in 2017 and in 2018 (30.7 % and 32.1 % respectively)
originated from renewable sources.
The average renewable electricity capacity per capita for the EU more than doubled in 2017 compared
with 2005 (0.8 kWe per person in 2017), with large differences between Member States. A similar
development was observed for the average RES-E capacity per unit of gross domestic product (GDP). It
also more than doubled in 2017, compared with 2005 (29 kWe per million euro of GDP), but large
differences remain visible between the Member States.
In the EU transport sector, renewable energy made up 7.6 % of all energy use in 2017 and 8.1 % in 2018,
according to reported data and the EEA’s early estimates. With renewable electricity currently playing only
a small role in transport, the bulk of renewable energy use in this sector comes from biofuels. To prevent
potential negative impacts on climate, the environment and interactions with food production from land-
use (such as when natural forests and food crops are displaced by biofuels), only certified biofuels that
comply with the sustainability criteria under the RED can be counted towards the RED targets. Certification
is carried out through voluntary schemes recognised by the European Commission and through national
systems set up by the Member States.
Transport biofuels grew fastest over the period 2005-2017 (at 7 percentage points increase per year, on
average), as they increased from a very low level in 2005. Nevertheless, considerable efforts are needed
in this market sector in the run-up to 2020 to reach the 10 % RES target in transport by 2020 at the national
and at the EU level. A higher share of renewable electricity use in the transport sector would reduce the
pressure on transport biofuels to reach the EU’s target of a 10 % RES share consumed in transport by 2020.
The increased use of renewable energy sources since 2005 allowed the EU to cut its fossil fuel use and
the associated greenhouse gas emissions by, respectively, 168 Mtoe and 543 Mt CO2 in 2018
The additional consumption of renewable energy compared with 2005 levels, allowed the EU to cut its
demand for fossil fuels by 156 million tonnes of oil equivalent (Mtoe) in 2017. This is equivalent to 11 % of
the EU’s gross inland consumption of fossil fuels and this amount is higher than the fossil fuel consumption
of the United Kingdom (see Figure 1). In 2018, the amount of substituted fossil fuels is estimated to have
increased by 12 Mtoe to a total of 168 Mtoe.
These fossil fuel savings due to the additional use of renewable energy after 2005 helped the EU achieve
an estimated gross reduction in CO
2
emissions of 502 Mt CO
2
(10 %) in 2017, compared with a
counterfactual scenario in which RES consumption would have stayed at the 2005 level. This almost
represents the annual GHG emissions of the United Kingdom. In 2018, the effect on CO
2
emissions
increased further, resulting in a gross emission reduction of 543 Mt CO
2
(an 11 % gross reduction in the
EU). Most of these changes took place in energy-intensive industrial sectors under the EU Emissions
Trading System (ETS), as the increase in renewable electricity decreased the reliance on fossil fuels and
made up roughly three quarters of the estimated total EU reductions.
Eionet Report - ETC/CME 2019/8 3
National RES deployment since 2005 led to the largest absolute reduction in domestic fossil fuel use and
avoided GHG emissions in Germany, Italy and the United Kingdom in both 2017 and 2018. However, in
terms of their overall effectiveness in substituting fossil fuels and reducing GHG emissions by increasing
their RES deployment three of the Nordic countries (Denmark, Finland and Sweden) remained the most
effective Member States in the EU in 2017 (see Figure 1).
The increased use of renewable energy sources since 2005 allowed the EU to cut its emissions of NOx
and SO
2
, but caused an increase of PM and VOC emissions
At the EU level, for 2017, the total estimated RES effect results in a decrease of air pollutant emissions of
46 kt for NO
x
and 159 kt for SO
2
, compared with a counterfactual scenario in which RES consumption would
have remained at the levels of 2005. However, for PM
10
, PM
2.5
and VOCs emissions, the result is an increase
of respectively 149, 145 and 296 kt in 2017 compared with 2005. On the relative level, comparing to total
emissions frozen at 2005 level, the additional consumption of renewable energy sources across the EU
since 2005 has led to a decrease of SO
2
and NO
x
emissions in 2017, by 6 % and 1 %, respectively. In contrast,
an indicative increase of EU-wide emissions for PM and VOCs took place in 2017, following the increase in
biomass use since 2005 (by 13 % for PM
2.5
, 8 % for PM
10
and 4 % for VOCs).
Renewable energy has grown to account for more than 33% of the world’s total installed power
generating capacity in 2018
Renewable energy in power generation continued its strong pace in 2018. An estimated 171 GW was
installed worldwide, almost the same as 2017 additions, and total installed capacity grew more than 8%.
Renewables delivered more than one quarter (26 %) of the total global electricity generation in 2018.
Global investments in renewables have shown steady growth for more than a decade. This has led to a
more than doubling of global renewable electricity capacity between 2005 and 2018. By 2018, for the
fourth year in a row, more than half of all newly installed power capacity worldwide was of renewable
origin, as RES accounted for an estimated 70 % of added net power generation capacity in that year
(Frankfurt School-UNEP 2019; IRENA 2019a). In 2018, the EU still ranked second after China as regards
total installed and grid-connected domestic renewable electricity capacity.
Viewed from the perspectives of technology and the market sector, global RES development in 2018 was
dominated by high investment in solar and wind energy for electricity generation. Together, these
technologies accounted for over 80 % of total global RES investments (Frankfurt School-UNEP 2019). At
the other end, investments in biofuels (used mainly in transport) were lower in 2018 than in 2005, possibly
because interest in first-generation biofuel capacity is plateauing and second-generation biofuel
technologies still struggle to overcome technical and financial obstacles.
The EU is a global leader in renewable electricity capacity per capita, but fast activity becomes visible
outside the EU
With an average renewable electricity capacity of 0.82 kW installed per person in 2018, the EU is the clear
world leader on a per capita basis, ahead of the United States, Brazil and China. However, since 2017,
China has displaced the EU as market leader in solar PV capacity and in 2018, with 185 GW of installed
wind capacity, China displaced the EU also with regard to installed wind power capacity.
Over the period 2005-2018, the renewable electricity capacity installed per unit GDP in the EU grew faster
than the rate of growth in other world regions. In general, growth in renewable electricity capacity in the
EU has been particularly notable since 2009, which coincides with the adoption in 2009 of the EU climate
and energy package. However, countries such as China and India had higher growth rates in 2016-2017
than the EU. The recent agreement on the revised RED (EU 2018a), which sets the overall EU target for
RES to 32 % in 2030, and requires Member States to ensure via obligations on fuel suppliers that
renewables will reach a level of at least 14 % in transport by the same year, is expected to boost renewable
energy investments again in the EU.
Between 2005 and 2012, Europe recorded the highest annual shares of global new investments in
renewable power capacity. Despite declining from 46 % in 2005 to 15 % in 2017, these high annual shares
highlight Europe’s pioneering role in developing renewable energy globally. Since 2013, however, China
Eionet Report - ETC/CME 2019/8 4
has claimed the highest annual shares of global new investments in renewable power capacity. Moreover,
China registered a steep jump in its share in global investment, from 35 % in 2016 to 45 % in 2017.
However, the share declined to 32% in 2018, although China still dominates globally: global investment
activity is spreading to new attractive markets outside the EU.
Other countries are seeing faster progress in terms of the share of RES-related jobs per capita in the
labour force
The EU is also a key global player in terms of employment in the renewable energy sector, with an
estimated 1.2 million jobs related to renewables in 2018, or roughly 0.5 % of the total labour force (IRENA
2019b). In terms of proportion of renewable energy-related jobs in the labour force in 2018, it came fourth,
after Brazil, China and the United States. Within the EU, Germany was the number one employer in terms
of RES-related jobs per capita in the labour force, second only to Brazil on the global level.
The largest employers in the EU renewables sector are the wind, solar PV and solid biomass industries.
Following job losses since 2012, the total estimated employment of direct and indirect jobs in renewable
energy remained virtually the same in 2017 compared to 2016. However, this stable figure covers
fluctuations among technologies and countries. In 2017, employment grew in liquid biofuels, compared to
2016, but declined in all other renewables industries.
For 2030, Member States and the EU need to intensify their climate and energy efforts
To reach the EU climate and energy targets for 2030 and to become a sustainable, low-carbon economy
by 2050, Member States need to overcome a number of important challenges. In the short term, these
concern formulating adequate national decarbonisation targets and policy responses for 2030 that will
collectively deliver the EU’s climate and energy targets and the commitments under the international Paris
Agreement. In the medium term, Member States need to improve their national innovation capabilities to
increase benefits from the ongoing energy transition in Europe.
To maintain this momentum, the EU and its Member States should reinforce and build existing, home-
grown expertise and innovation capacity in renewable energy and energy efficiency solutions. This will
also help retain Europe’s global competitiveness in these growing knowledge-intensive sectors. To that
end, in 2018, the EU institutions agreed on a more systematic cooperation and coordination of national
policies and measures between Member States by adopting the RED II. The European Commission also
recently put forward a climate vision for 2050 (EC 2019b), which confirms the EU’s willingness to lead
global climate mitigation efforts and support the objective of full carbon neutrality by 2050.
Eionet Report - ETC/CME 2019/8 5
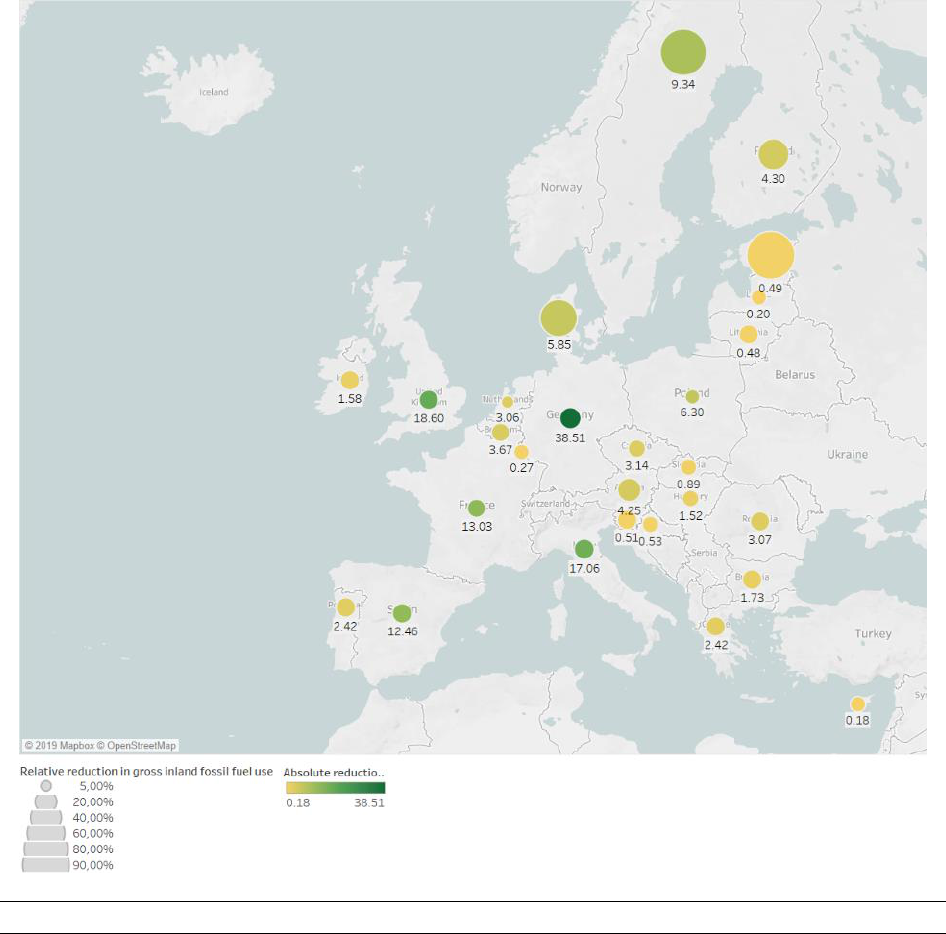
Figure 1 Total and relative reduction in gross inland fossil fuel use (per year, in 2017)
Notes: The absolute reduction in gross inland fossil fuel use in 2017, expressed in million tonnes of oil equivalent (Mtoe), is
proportional with the increase of renewable energy consumption achieved between 2005 and 2017. It represents the annual
estimate for 2017; the cumulative value over the period 2005 – 2017 is much larger. The relative reduction in gross inland fossil
fuel use is expressed as the absolute reduction over a country’s total gross inland consumption of fossil fuels.
Source: ETC/CME

Eionet Report - ETC/CME 2019/8 6
1 Introduction
1.1 Background: international and European context
Limiting global warming in line with the Paris Agreement (
2
) (UNFCCC 2015) to significantly reduce the risks
and the impacts of climate change requires fundamentally transforming our energy system and adjusting
our production and consumption patterns in just a few years.
Increased deployment of renewable energy sources (RES) plays an important role in mitigating climate
change and unfolding this transformation. With long-term energy demand overall stable or decreasing in
Europe, increasing the share of renewable sources of energy triggers the displacement of non-renewable
sources (especially fossil fuels) in power supply, heat production and transport, thereby reducing
greenhouse gas (GHG) emissions across all sectors. Renewables are thus a key pillar in delivering the
European Energy Union’s decarbonisation priority (see Box 1.1), achieving the EU’s climate commitments
under the Paris Agreement, and supporting the transition towards a greener, resource-efficient and more
competitive low-carbon EU economy and society by 2050.
To date, a broad set of complementary climate and energy policies support low-carbon energy
developments and aim to spur innovation in this field. Progress achieved in EU-wide renewable energy
deployment since 2005 is largely attributed to the presence of binding national targets for 2020 under the
Renewable Energy Directive, or RED (EU 2009), and to national support instruments put in place in
response to these targets, such as feed-in tariffs, feed-in premiums, auction/tender systems, quotas, tax
credits and grants.
Technological advances, the scaling up of global production volumes and a reduction in capital costs have
also each played an important role in lowering the costs of renewable energy, especially of wind power
and solar photovoltaic (PV) technologies (EC 2015; IRENA 2016). Nevertheless, the rapid initial
developments also triggered frequent adaptation of Member States’ policies to establish cost-effective
support and, in some cases, even to abrogate that support. As many of these changes fuelled uncertainty
on the markets, auction-based programmes have come to replace the initial subsidy-based support
measures in Europe, and increasingly globally, pushing renewable energy projects to become more cost-
competitive and contributing to further reductions in the costs of renewable energy projects (Frankfurt
School-UNEP 2019).
In recent years, however, the annual pace of growth in the EU has stagnated or decreased for most
renewable electricity (RES-E) technologies and for renewable heating (RES-H) from solar thermal and heat
pumps. It has continued to increase for only a few other renewable energy technologies (i.e. geothermal
and solid biomass-based technologies). This loss of speed initially took shape in the aftermath of the
financial crisis, when many support mechanisms were scaled back, sometimes cut entirely or were
retroactively changed. Subsequently, economic growth resumed across countries and, since 2015, energy
consumption from non-renewable sources increased by more than that from renewable ones, as a result
of increased energy use in the transport sector and low carbon prices in the EU’s electricity market. The
increasing number of countries getting closer to, or having reached their renewable energy targets for
2020 ahead of time, may offer a further explanation, in the context in which the recast of the RED (RED II)
(EU 2018a) sets a binding EU-level target for renewable energy consumption by 2030 (of 32 %) and invites
Member States to define their own national contributions to achieving that target as part of their
integrated national energy and climate plans (NECP) under the Energy Union Governance Regulation (EU
(
2
) The Paris Agreement’s central aim is to strengthen the global response to the threat of climate change by keeping
the global temperature rise this century well below 2 °C above pre-industrial levels and to pursue efforts to limit
the temperature increase even further to 1.5 °C. The Paris Agreement requires all Parties to put forward their
best efforts through ‘nationally determined contributions’ (NDCs) and to strengthen these efforts in the years
ahead (UNFCCC 2015).

Eionet Report - ETC/CME 2019/8 7
2018b). By the end of 2018, most Member States had submitted draft plans to the EC. Following that, in
June 2019 the EC issued recommendations on the draft plans; Member States have to consider these when
submitting their final NECPs, by the end of 2019.
The EC’s assessment of the draft plans shows that almost all Member States have submitted their
contributions to the EU renewable energy target. Almost a third of the Member States submitted
ambitious contributions. Despite that, there is still a gap in ambition when considering the EU’s target for
2030: under the current draft plans, the EU-wide share of renewable energy sources would reach between
30.4% and 31.9% in 2030, instead of at least 32% (EC 2019a). In addition to the lack of ambition in some
of the NECPs, another issue is the scarcity of indications in the plans on how to achieve the investments
for the needed renewable energy capacity.
However, to reach with certainty the mandatory 20 % share of EU renewable energy consumption by 2020
and the 10 % RES sub-target for the transport sector, in the context of the recent upwards trend in energy
consumption, sustained efforts and corresponding adaptation of national policies to promote renewable
energy projects will be indispensable in the very short run (EEA 2018b).
Box 1.1 EU renewable energy policies up to 2020 and 2030
The EU was an early adopter of renewable energy starting with the implementation of EU-wide policies from the
mid-nineties. After the first directive on electricity production from renewable energy sources (2001) with
indicative targets, the review (in 2005) of Member States’ supporting schemes led to a period of debate and
negotiations between Member States and the EU institutions. This resulted, in 2009, in the RED (2009/28/EC),
which set legally binding national targets contributing to an EU-wide target of 20 % renewable energy in the total
energy needs by 2020.
The binding national targets are set at different levels to reflect national circumstances. The EU’s renewable
energy target for transport (i.e. a 10 % share by 2020) is divided equally for all countries into 10 % national
targets, with biofuels produced from energy crops grown on agricultural land limited to a maximum of 7 %. The
RED also sets out options for cooperation to help countries achieve their targets cost-effectively.
In the run-up to 2020, two interim trajectories are of particular interest in assessing the EU’s and Member States’
progress towards their binding targets:
• The minimum indicative RED trajectories for each country. These trajectories concern only the total
RES share. They run until 2018, ending in 2020 with the binding national RES share targets. They are
provided in the RED to ensure that the national RES targets will be met.
• The expected trajectories, adopted by Member States in their national renewable energy action plans
(NREAPs) under the RED. These NREAP trajectories concern not only the overall RES share but also the
shares of renewables in the electricity, heating and cooling, and transport sectors up to 2020.
For 2030, the RED II sets a binding EU-wide target of 32 % RES in gross final energy consumption. Member States
have proposed an indicative level of effort contributing to the EU binding target for renewables in their draft
NECPs. The binding national RES targets for 2020 remain in the recast directive as baseline levels. The RED II also
includes:
• guiding principles concerning financial support schemes for RES-E;
• the requirement for Member States to set up ‘one-stop shops’ to coordinate the entire permit-granting
process for new RES generation, transmission and distribution capacity;
• principles of renewable self-consumption and (local) renewable energy communities;
• enhancement of existing provisions on cross-border cooperation;
• provisions to improve the sustainability and GHG emissions-saving criteria for biofuels, bioliquids and
biomass;
• mainstreaming of renewable heating and cooling (RES-H&C) applications, in particular by asking
Member States to increase the share of renewable energy supplied for heating and cooling by a fixed
rate (by an indicative 1.3 percentage points for 2021-2025 and higher thereafter) per year, starting from
the level achieved in 2020.

Eionet Report - ETC/CME 2019/8 8
Outlook beyond 2020
In June 2018, European countries gave their endorsement to a binding EU-wide renewable energy target
of a minimum of 32 % of gross final consumption by 2030, which is included in the recast Renewable
Energy Directive (RED II) that entered into force at the end of 2018. Building on the Energy Union strategy
of 2015 (EC 2015), as well as on the Regulation on the Governance of the Energy Union (EU 2018b) (
3
),
Member States had to propose an indicative level of effort contributing to the EU binding target for
renewable energy as part of their draft integrated national energy and climate plans, by the end of 2018.
Following the Commission’s recommendations of June 2019, as necessary, Member States have to
heighten their contributions in their final plans due at the end of 2019.
The increased target for renewable energy (original target of at least 27 %, revised upwards to 32 % in
2018) as well as the increased target for energy efficiency (original target 27 %, revised upwards to 32.5 %
in 2018) by 2030 are important in light of the “at least 40%” greenhouse gas emission reduction. Together
these targets form the backbone of the 2030 climate and energy framework which was adopted by the
European Council in October 2014.
Since the renewable energy target is defined as the share of renewable energy in gross final energy
consumption it is clear that the role of energy savings and improved energy efficiency in gross final
consumption cannot be underestimated.
In the run-up to 2030, the indicative RES trajectory of the EU (based on the collective efforts of the Member
States) should reach at least the following reference points for the total increase in the RES share between
the binding 20 % RES share target for 2020 and the binding 32 % RES share target for 2030: 18 % by 2022;
43 % by 2025; 65 % by 2027. Should Member States fall behind similar reference points in relation to their
RES trajectories in the integrated national energy and climate plans, they will need to implement additional
measures to cover the gap within 1 year (EU 2018b). The RED II intends to mainstream renewable energy
in heating and cooling and thus includes a trajectory for this purpose. Member States are urged to make
an effort to increase the share of renewable energy by an indicative 1.3 percentage points as an annual
average calculated for the periods 2021 to 2025 and 2026 to 2030, starting from the share of renewable
energy in the heating and cooling sector in 2020, expressed in terms of national share of final energy
consumption. The increase shall be limited to an indicative 1.1 percentage points for Member States where
waste heat and cold is not used (EU 2018a).
Beyond Europe
In the past, the EU has been a frontrunner in renewable energy. Nevertheless, with developing countries
investing more in green energy than developed economies, the situation may be changing in the short run
(see Chapter 1).
1.2 About this report
This EEA report depicts changes in RES in Europe since 2005, at the level of individual technologies and
countries (Chapter 2) and outlines key global developments to put European progress in perspective
(Chapter 1). It also illustrates the co-benefits of growing RES consumption in Europe, notably the
replacement of fossil fuels by a growing share of renewables and the resulting effects on the reduction in
GHG emissions and air pollutant emissions (Chapter 0). This chapter sets the overall context.
The assessment uses Eurostat data for the period 2005-2017, complemented by early EEA estimates
regarding GHG emissions and energy developments in 2018.
(
3
) The Regulation on the Governance of the Energy Union, which entered into force at the end of 2018, is a
horizontal piece of legislation that aims to streamline monitoring and reporting of progress, and increase
synergies and cooperation across all dimensions of the Energy Union, so as to obtain a high level of policy
coherence through integrated national energy and climate plans.

Eionet Report - ETC/CME 2019/8 9
1.2.1 Geographical scope
Owing to the limited availability of primary data, this assessment focuses on the 28 EU Member States
(EU-28). In Chapter 1, capacities and investments in RES-E are aggregated into relevant world regions to
facilitate a comparison of the EU’s progress with international developments. Details of the geographic
aggregation are presented in the glossary.
1.2.2 Data sources and methodologies
Approximated estimates for the share of gross final consumption of renewable energy resources (RES
share proxies)
The EEA 2018 RES shares are, ultimately, estimated values. Although the 2018 RES shares proxies formed
the basis of a specific EEA country consultation, carried out in September 2019 (
4
), these values are not a
substitute for data that countries officially report to Eurostat.
The methodology applied for approximating RES values in the year t-1 was described in a previous EEA
report (EEA 2015) — see also Annex 3. Confidence in the estimated RES share proxy values is greatest in
the electricity sector. The dynamics in the renewable heating and cooling market sector may be
underestimated due to the more limited data available for this sector. Finally, the specific accounting rules
in the RED concerning renewables consumed in transport remain difficult to replicate. Despite these
challenges, the estimation of RES share proxies yields plausible results in most cases and should be further
improved, especially as more timely information and data that are relevant for the estimations become
available.
Gross avoided greenhouse gas emissions due to avoided fossil fuel use
Chapter 0 estimates the gross effects of renewable energy consumption on GHG emissions based on
primary data available from Eurostat for primary energy consumption in 2018. The term ‘gross avoided
GHG emissions’ illustrates the theoretical character of the GHG effects estimated in this way, as these
contributions do not necessarily represent ‘net GHG savings per se’ or are not based on life-cycle
assessment or full carbon accounting (
5
). Considering life-cycle emissions could lead to substantially
different results. It is important to note that, because the base year of this analysis is 2005, the
development of renewable energy from only that point in time is considered. Section 0 illustrates the
avoided fossil fuel use at the Member State level. The relative effects are shown with respect to gross
inland fossil fuel use per country (see Figure 20). Section 0 also estimates the effects on energy
consumption. A detailed description of the methodology applied for approximating these effects was
provided in a previous EEA report (EEA 2015).
Gross effect of renewable energy on air pollutant emissions
(
4
) The approximated GHG emissions, energy consumption and RES proxy data were sent for consultation to the
European Environment Information and Observation Network (Eionet) of environmental bodies and institutions
active in the EEA member countries. These proxies were finalised in October 2019, after the Eionet consultation.
(
5
) In the absence of specific information on current bioenergy systems, CO
2
emissions from the combustion of
biomass (in solid, liquid and gaseous forms) were not included in national GHG emission totals in this report, and
a zero emission factor had to be applied to all energy uses of biomass. This should not be interpreted, however,
as an endorsement of default biomass sustainability or carbon neutrality. It should be noted that, according to
the United Nations Framework Convention on Climate Change (UNFCCC) reporting guidelines, these emissions
have to be reported separately in GHG inventories as a memorandum item (mainly to avoid double counting of
emissions from a reporting perspective), with the assumption being that unsustainable biomass production
would show as a loss of biomass stock in the land use, land use change and forestry (LULUCF) sector and not in
the energy sector.

Eionet Report - ETC/CME 2019/8 10
Chapter 3 also estimates the gross effect of renewable energy consumption on air pollutant emissions.
Based on the gross final energy consumption of renewable energy technologies (RETs), the attributes of
individual RETs, the primary energy use per unit of electricity or heat, the implied emission factors
calculated with GAINS data, an estimate is made of the gross effect of renewable energy on air pollutant
emissions for the EU-28 and per Member State (ETC/CME 2019a; ETC/CME 2019b).
Renewable energy investments
To date, a central, publicly available source of information on global RES technology investments is missing.
The comprehensive information used in this assessment is sourced from the Global trends in renewable
energy investment annual report (Frankfurt School-UNEP 2019). The period covered is 2005-2018 and the
focus is on new renewable energy investments per region. While analysing investments, the report
includes projects on renewable power and fuels — wind, solar, biomass and waste, biofuels, geothermal
and marine projects, and small hydro-electric dams of less than 50 MW. It does not cover larger hydro-
electric dams of more than 50 MW. Investment figures were originally supplied in nominal billions of US
dollars. Full comparability across regions and time remains limited, as nominal values include inflation (
6
).
For the purpose of this report, figures in US dollars have been converted to euros using the Eurostat data
set on exchange rates (Eurostat 2019b).
Renewable energy employment
The renewable energy sector requires specific skills and value chains, which lead to the creation of new
jobs. Job numbers can be estimated using various methods with different levels of detail. As data
availability varies across regions and data differ as regards quality and methods, a consistent time series
is not yet available. For these reasons, only a snapshot of the recent past (2017), by available region and
technology, can be shown. Direct and indirect jobs related to renewable energy per region for 2017 are
presented below and stem from the International Renewable Energy Agency (IRENA 2019b).
Newly introduced Eurostat codes and descriptions
In January 2019, Eurostat introduced a novel methodology for the energy balances, mostly to harmonise
codes and labels with international statistics. Eurostat therefore established new specific indicators and
used those in the calculations: Gross Inland Consumption (Europe 2020-2030); Primary Energy
Consumption (Europe 2020-2030); Final Energy Consumption (Europe 2020-2030) (
7
). These indicators
flank the new GIC, PEC, and FEC indicators that are “[…] calculated to ensure continuity and transition from
the old Eurostat energy balance into the new Eurostat energy balance”.
The “Europe 2020-2030” indicators have been used exclusively when referring to total amounts, to check
the trend towards the 2020 targets. The other indicators have been used when breaking down the analysis
for specific fuels, e.g. fossil fuels. This distinction was needed for both the lack of data for single fuels in
the “Europe 2020-2030” indicators, as well as a more scientifically correct analysis for the fossil fuels
themselves. The related tables and figures will state which indicator has been used.
On another note, the “Combustible fuels” label does not exist anymore as a single indicator – but it is,
instead, now possible to calculate the indicators for the desired fuels. The full list of fuels included in the
calculations is presented below:
(
6
) To adjust for inflation one would need to consider individual inflation rates — or deflators — for each of the
regions. As the regions are composed of heterogeneous countries, probably experiencing different levels of
inflation, it is not possible to make this conversion. This needs to be taken into account when interpreting the
data.
(
7
) For the exact definition, refer to the official documentation.
Eionet Report - ETC/CME 2019/8 11
C0110
Anthracite
O4300
Refinery feedstocks
C0121
Coking coal
O4610
Refinery gas
C0129
Other bituminous coal
O4620
Ethane
C0210
Sub-bituminous coal
O4630
Liquefied petroleum gases
C0220
Lignite
O4640
Naphtha
C0311
Coke oven coke
O4652XR5210B
Motor gasoline (excluding
biofuel portion)
C0320
Patent fuel
O4661XR5230B
Kerosene-type jet fuel
(excluding biofuel portion)
C0330
Brown coal briquettes
O4671XR5220B
Gas oil and diesel oil
(excluding biofuel portion)
C0340
Coal tar
O4680
Fuel oil
P1100
Peat
O4694
Petroleum coke
P1200
Peat products
O4695
Bitumen
G3000
Natural gas
W6100
Industrial waste (non-
renewable)
O4100_TOT
Crude oil
W6220
Non-renewable municipal
waste
O4200
Natural gas liquids
Table 1 - List of fuels included in the calculations for Eurostat indicators
Other observations
For offshore wind, 2005-2017 data are calculated based on capacities reported by EurObserv’ER, while
2018 data are calculated on capacities reported by WindEurope. The decision to go for these sources
instead of Eurostat SHARES values came from the incompleteness of the information in the latter source.
All of the production calculations are based on an assumption of 4 000 full load hours of operation. The
offshore wind production is then subtracted from the total wind production reported by Eurostat (Eurostat
2019d) and the result is attributed to onshore wind production. The total of onshore and offshore wind
power generation is equal to the total for wind power reported by Eurostat. Data for 2020 originate from
table 10 in each country’s NREAP, where there is separate reporting for onshore and offshore wind power.
In the context of renewable energy use in transport the terms ‘other biofuels’ and ‘all biofuels’ are
understood to also include biogas and other liquid biofuels used in transport. Similarly, in the context of
RES-E generation, the term ‘solid biomass’ is understood to also include renewable municipal waste.
The methods applied in this report to estimate the impact of the uptake of renewable energy on energy
consumption and GHG emissions cannot be used to assign these effects to particular drivers,
circumstances or policies, other than the increased consumption of renewable energy itself. These
methodologies provide valuable insights, but as the assumptions are static (i.e. the same set of
assumptions is applied to all years in the period), assumptions need to be re-adjusted at times to reflect
real-life conditions. A detailed description of the methods was given in a previous report (EEA 2015).

Eionet Report - ETC/CME 2019/8 12
2 Developments in renewable energy sources in Europe
Key messages
• The EU share of renewable energy in 2017 (17.5 %) was almost twice as high as in 2005 (9.1 %). However, it has
increased by only 0.5 percentage points since 2016.
• According to preliminary estimates calculated by the EEA, the EU’s RES share also continued to grow in 2018,
reaching an estimated 18.0 % share in gross final consumption (
8
).
• The EU RES share in both 2017 and 2018 exceeded the EU’s indicative trajectory under the RED (16.0 % in 2017
and 2018). However, reaching with certainty the mandatory 20 % EU RES share in energy consumption and the
10 % RES sub-target for transport by 2020 calls for continued efforts to deploy renewables and to address the
recent increases in energy consumption across some countries. Furthermore, ambitious national objectives and
the recalibration and adaptation of national RES support policies are indispensable in the short run, if we are to
meet the collective EU decarbonisation and energy targets for 2030 and in the longer term.
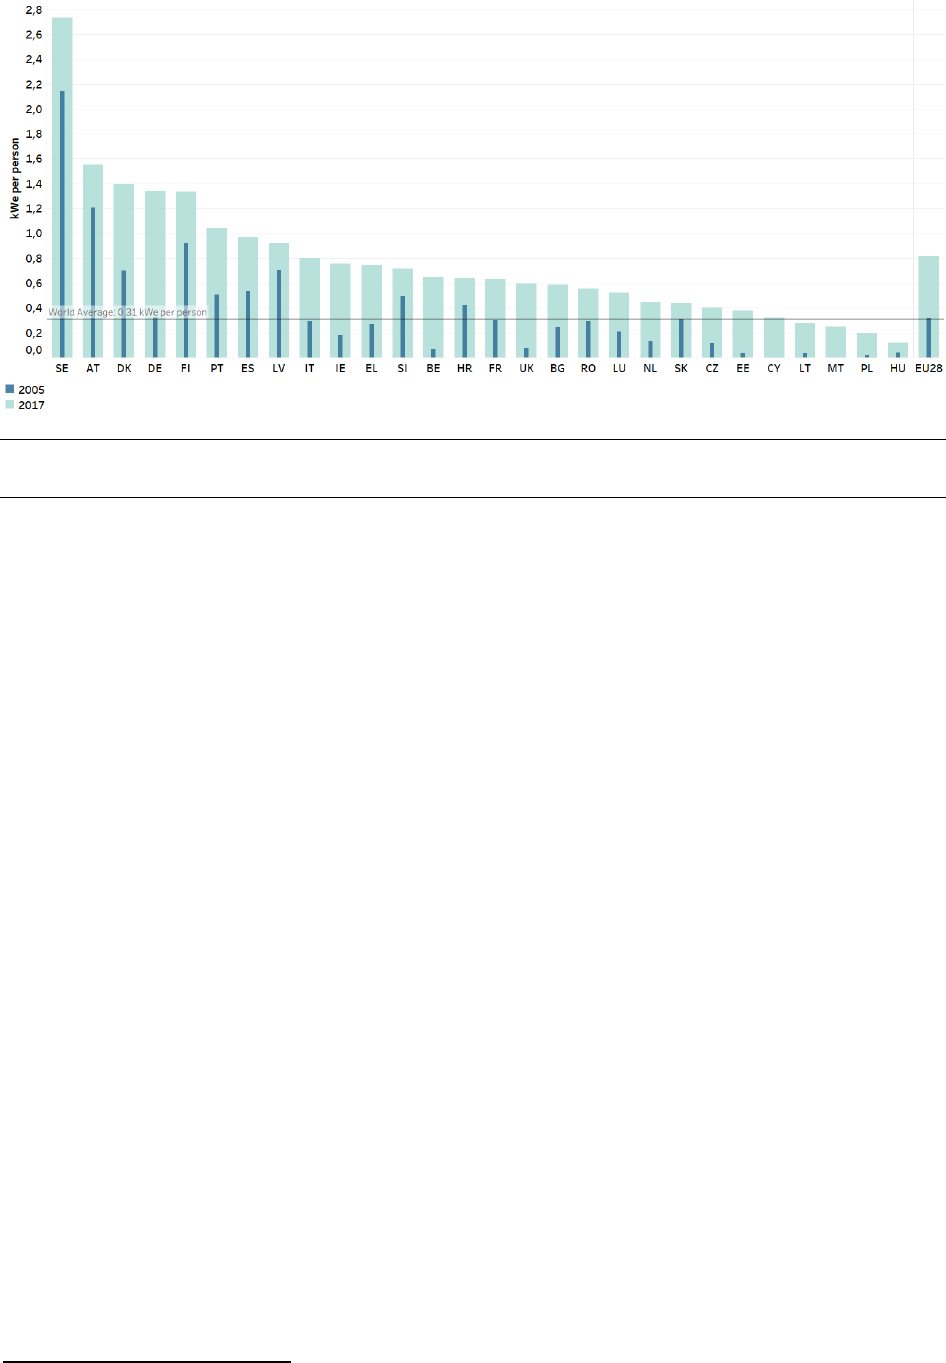
• On a per capita basis, the average RES-E capacity for the EU had more than doubled by 2017 (0.8 kWe per person)
compared with 2005. While differences between Member States remain large, in 23 EU countries installed RES-
E capacities per capita were larger than the world average (0.3 kWe per person) in 2017.
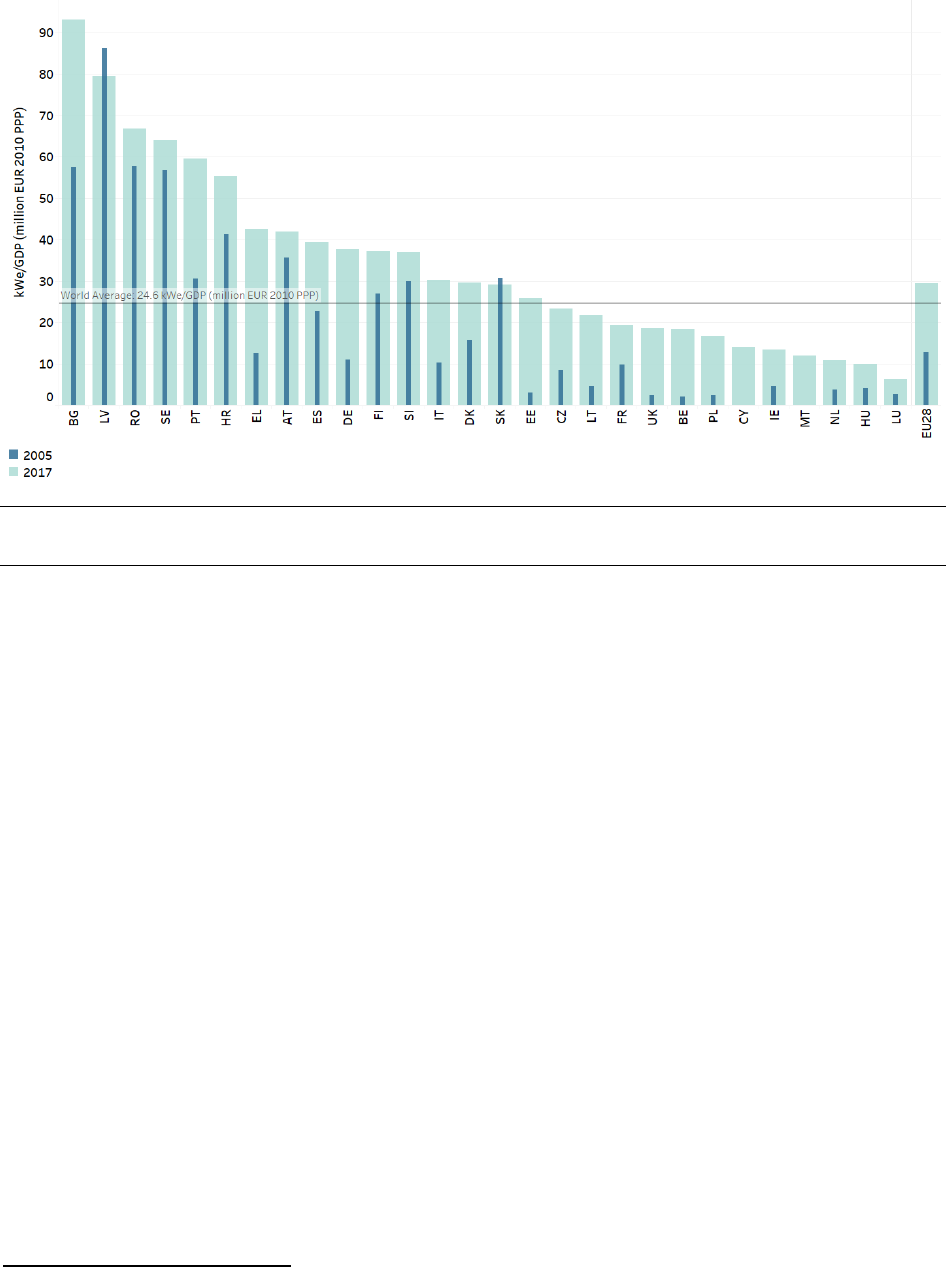
• Expressed per unit of gross domestic product (GDP) (
9
), the EU’s average RES-E capacity has developed in a similar
way since 2005, having more than doubled by 2017 (29 kWe per unit of GDP). Per unit of GDP, installed capacities
in 2017 were larger than the world average (24.6 kWe per unit of GDP) in 16 of the 28 EU Member States.
• Across the EU, in absolute terms, the largest market sector for renewable energy use remains heating and
cooling. Renewables made up close to one fifth of all final energy consumed for heating and cooling in the EU.
• Electricity is the second largest market sector for renewable energy use in the EU (RES-E share of 30.7 % in 2017
and 32.1 % in 2018 according to the early EEA estimates).
• Transport is the third and smallest market sector for renewables (7.6 % in 2017 and 8.1 %in 2018, according to
the early EEA estimates). Renewable energy use in transport (including only biofuels certified in accordance with
the existing sustainability criteria) varied significantly among Member States.
• Certain renewable energy technologies have already surpassed the levels of deployment expected for 2020 in
NREAPs, notably RES-H&C from solid biomass and RES-E from solar PV and biogas.
(
8
) The approximations are made using a harmonised method that can be applied to all Member States using
centrally available and harmonised data sets. It is not intended to be a tailor-made approach and the results
need to be considered with that in mind. Countries were invited to provide national data and estimates in the
context of an Eionet consultation in 2019. For details, see Annexes 3 and 4.
(
9
) GDP expressed in constant 2010 euro value (EUR
2010
), at purchasing power parity (PPP).
Eionet Report - ETC/CME 2019/8 13
2.1 Recent progress in deployment of renewable energy sources
2.1.1 Renewable energy shares at the EU level and in individual Member States
The RED (EU 2009) sets minimum indicative trajectories for each country, which end in the binding national
RES share targets for 2020. Progress towards these 2020 targets is assessed by comparing the most recent
developments with these interim trajectories. The indicative RED target for the EU is 13.8 % for the years
2015 and 2016 and 16 % for the years 2017 and 2018. Having achieved a RES share of 17.5 % in 2017 and
an estimated share of 18.0 % in 2018, the EU has surpassed the indicative target level set in the RED.
The RES share increased annually by 8 percentage points, on average, between 2005 and 2017, with the
pace of growth decreasing in 2016 and 2017 (to 2 and 3 percentage points, respectively). It is worth noting
that gross final energy consumption decreased between 2005 and 2017 by 0.5 percentage point, on
average, but it increased in 2015, 2016 and 2017, with respectively 2, 2 and 1 percentage points,
respectively. According to early EEA estimates, final energy consumption continued to increase by 0.1 %
in 2018 compared to 2017. As shown elsewhere, the slowdown in the annual increase in the RES share in
recent years was due to the increase in final energy consumption in recent years. If this latter trend is not
reversed, it could jeopardise the achievement of the 20 % renewable energy target at EU level for 2020
(EEA 2019). In addition, the current average pace of renewable energy deployment across Europe would
not enable the EU to achieve the new RES target, of 32 % by 2030. Meeting the more ambitious EU-level
RES (and climate mitigation) targets for 2030 and 2050 calls for steeper deployment rates of RES across all
sectors and especially in heating and cooling, and in transport (EEA 2019).
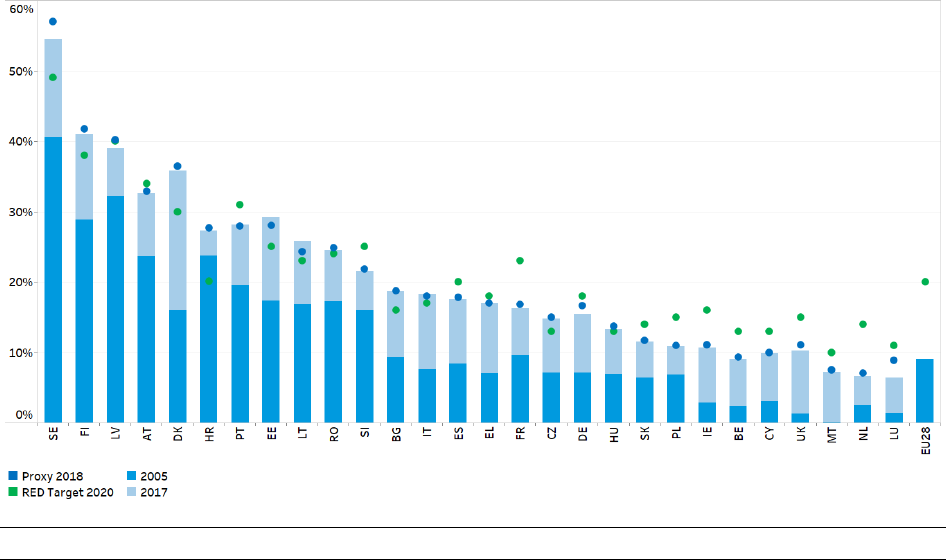
Figure 2 shows the actual RES shares in the EU Member States and for the EU for 2005 and 2017. The RES
shares vary widely among countries. In 2017, the highest shares of renewable energy were attained by
Sweden (54.5 %), followed by Finland (41.0 %) and Latvia (39.0 %). Luxembourg (6.4 %), the Netherlands
(6.6 %) and Malta (7.2 %) realised the lowest shares. Figure 2 also shows the RED target share for 2020.
This overall target was calculated for individual Member States to reflect their national circumstances, RES
potentials and starting points.
Eionet Report - ETC/CME 2019/8 14
Figure 2 Actual and approximated RES shares in the EU and its Member States
Notes: The dark blue bars show the RES shares in 2005. The tops of the light blue bars show the levels that the RES shares reached
in 2017
Sources: ETC/CME, (EEA 2018a); (Eurostat 2019d); RED (2009/28/EC).
2.1.2 Renewable electricity capacities per capita and per unit of gross domestic product
The average RES-E capacity per capita for the EU-28 had more than doubled by 2017, compared with 2005,
from around 0.3 kWe installed per person in 2005 to over 0.8 kWe installed per person in 2017. Sweden
had the largest installed capacity per person in 2017 of 2.7 kWe installed per person, followed at a distance
by Austria, Denmark, Germany and Portugal (1.3 to 1.6 kWe per person). However, since 2005, the largest
growth in RES-E capacity per capita has been observed in Malta, Cyprus, Estonia, Poland, Belgium, the
United Kingdom, Lithuania, Ireland, Germany, the Czech Republic and the Netherlands (all more than
300 % growth), followed by Hungary, Greece, Italy, Luxembourg, Bulgaria, France, Portugal and Denmark
(growth between 200 % and 300 %). The remaining countries (Romania, Spain, Croatia, Finland, Slovenia,
Slovakia, Latvia, Austria and Sweden) showed lower growth rates (< 200 %). The majority of EU Member
States (23) had installed capacities in 2017 that were greater than the world average (see Figure 3 and
Figure 32).
Eionet Report - ETC/CME 2019/8 15
Figure 3 RES-E capacities, excluding pumped storage, per capita in the EU and its Member States, 2005
and 2017
Sources: ETC/CME, (Eurostat 2019d), (Eurostat 2019c); (IRENA 2019a)
Similar to the average RES-E capacity per capita, the average RES-E capacity per unit of GDP for the EU-28
has more than doubled since 2005, reaching 29 kWe/GDP (
10
) in 2017. In 2017, Bulgaria, Latvia and
Romania had the largest installed capacities per unit GDP (65 kWe/million EUR
2010
(PPP) or more) followed
by Sweden, Portugal, Croatia, Greece and Austria (40 to 65 kWe/million EUR
2010
(PPP)). The largest growth
in RES-E capacity per GDP since 2005 can be observed in Malta, Cyprus, Belgium, Estonia, the United
Kingdom, Poland and Lithuania (all more than 450 % growth), followed by Germany, Greece, Ireland, the
Netherlands, Italy, Czech Republic, Hungary and Luxembourg (between 200 % and around 350 % growth).
The remaining countries (France, Portugal, Denmark, Spain, Bulgaria, Finland, Croatia, Slovenia, Austria,
Romania, Sweden, Slovakia and Latvia) showed lower growth rates (< 200 %) per unit of GDP. Per unit of
GDP, installed capacities in 2017 were larger than the world average (24.6 kWe per unit GDP) in 16 of the
28 EU Member States (see Figure 33).
(
10
) GDP expressed in constant 2010 euro value (EUR
2010
) at PPP.
Eionet Report - ETC/CME 2019/8 16
Figure 4 RES-E capacities, excluding pumped storage, per GDP in the EU and its Member States, 2005
and 2017
Sources: ETC/CME; (Eurostat 2019d); (IRENA 2019a);(Eurostat 2019b).
2.2 Contributions of renewable energy sources by energy market sector and technology
In 2010, Member States submitted NREAPs in which they outlined their expected national paths to meet
their binding 2020 RES targets and included separate trajectories for RES-E, RES-H&C and renewable
energy consumption in the transport sector (RES-T). The expected paths in the NREAPs are, overall, more
ambitious than the indicative RED trajectories. This section shows the progress achieved by RES within the
three energy market sectors and compares it with the expected (NREAP) development in these market
sectors.
The expected (NREAP) trajectories of individual technologies enable progress to be monitored, but they
become increasingly outdated as conditions and policies change (
11
). In fact, because of steep learning
curves, the rapid development and consequent cost reductions achieved by some renewable energy
technologies have already led to higher shares of these technologies than were anticipated to have been
reached by 2020 in the NREAPs.
At EU level, in absolute terms RES-H&C remains the dominant RES market sector (see Section 2.2.3),
followed by RES-E (see Section 2.2.2) and RES-T (see Section 2.2.4).
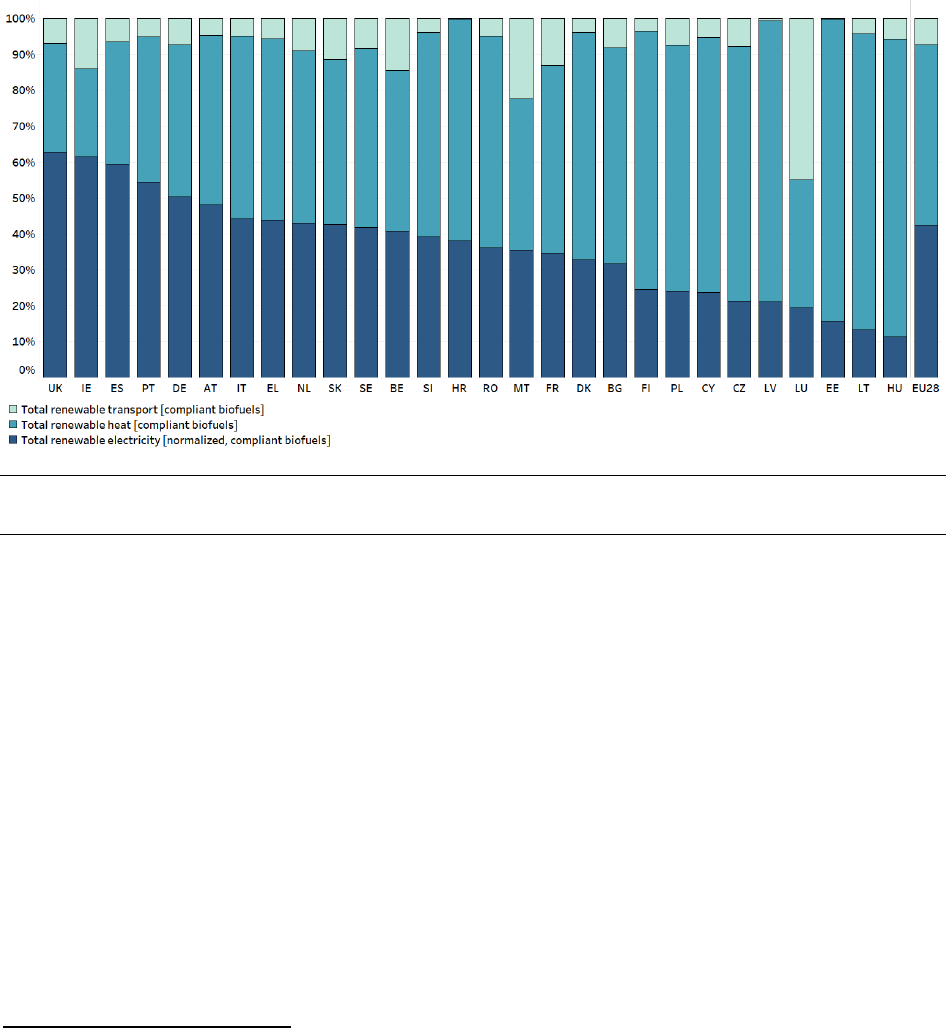
2.2.1 Contribution of renewable energy sources to various energy market sectors in Member States
At the country level, the significance of each energy market sector, and the role renewable energy plays
therein, differs considerably. Figure 5 Shares in 2017 RES consumption of renewable electricity, renewable
heating and cooling, and biofuels in transport illustrates these differences by showing the split of gross
final renewable energy consumption by market sector in each country. In 2017:
(
11
) Some countries have updated their NREAPs since 2010. The most recent versions were used for this report.
Austria, Bulgaria, Czech Republic, Denmark, Estonia, Ireland, Poland, Spain and Sweden updated their overall
RES shares, or their RES shares per technology, for one or several years, as additional information to the
Commission's questions or in a resubmission of their NREAP. The latest version of Malta’s NREAP is from 2017
and this version was used for this report.
Eionet Report - ETC/CME 2019/8 17
• Renewable heating and cooling represented more than half of all gross final consumption of
renewables in 16 Member States (Bulgaria, Croatia, Cyprus, Czech Republic, Denmark, Estonia,
Finland, France, Greece, Hungary, Italy, Latvia, Lithuania, Poland, Romania and Slovenia).
• Renewable electricity represented over half of all RES consumption in only five countries (in
descending order: the United Kingdom, Ireland, Spain, Portugal and Germany).
• The contribution of renewable transport fuels (certified biofuels) was on average 7.3 %, but varied
significantly among Member States from a maximum of 45 % of all RES consumption (Luxembourg) to
less than 1 % (Croatia, Estonia and Latvia).
Figure 5 Shares in 2017 RES consumption of renewable electricity, renewable heating and cooling, and
biofuels in transport
Notes: This figure shows how actual final renewable energy consumption in 2017 is distributed over RES-E, RES-H&C and biofuels
in transport. Wind power and hydropower are normalised (
12
). The consumption of RES accounts for only biofuels complying with
the RED sustainability criteria.
Source: Compiled from data in (Eurostat 2019d).
The variations observed across countries in the relative importance of each market sector are due to
specific national circumstances, including different starting points in terms of the deployment of RES,
different availability of low-cost renewables, country-specific demand for heating in the residential sector
and different policies to stimulate the deployment of renewable energy.
2.2.2 Renewable electricity
In 2017, the EU-wide share of RES-E amounted to 30.7 % — more than twice the level in 2005. Figure 6
RES-E in the EU and Table 2 RES-E in the EU, by RES technology show the consumption of RES-E up to 2017,
approximated estimates for 2018 and the expected NREAP developments by 2020.
• The gross final energy consumption of RES-E continued to increase, reaching 86.7 Mtoe in 2017.
(
12
) Under the accounting rules in the RED, electricity generated by hydro- and wind power needs to be normalised
to take into account annual climatic variations (hydro for 15 years and wind for 5 years).
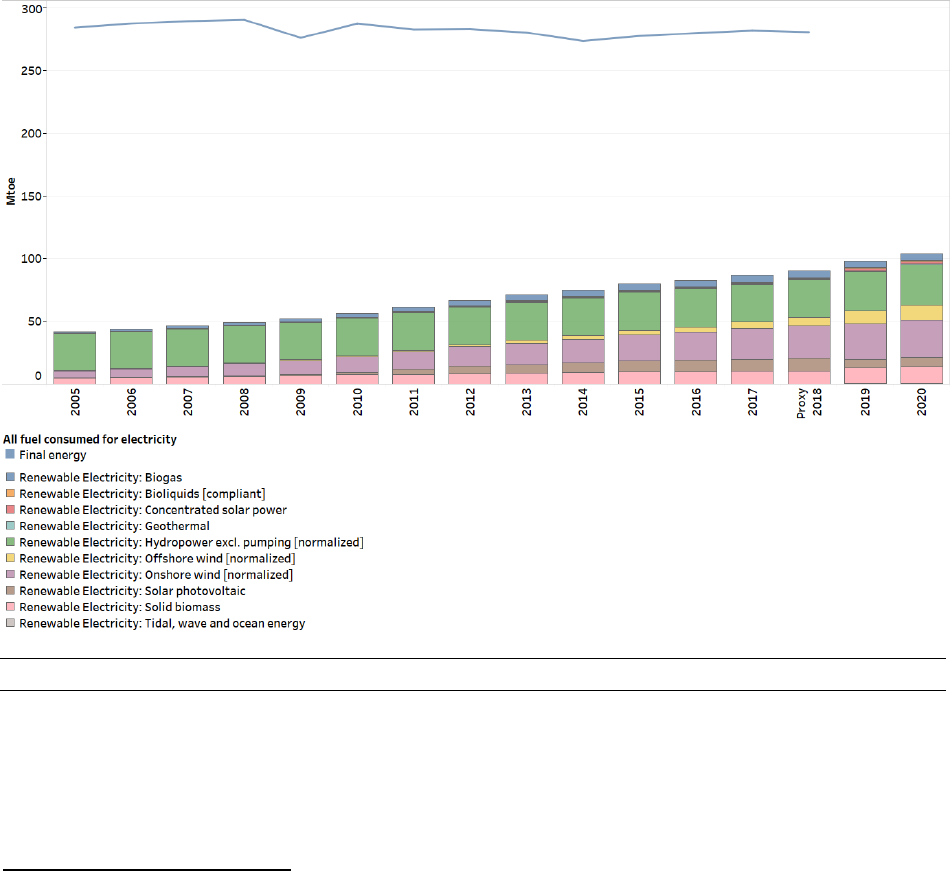
Eionet Report - ETC/CME 2019/8 18
• In 2017, the largest contributions came from hydropower and wind power (35 % and 34 % of all
RES-E, respectively) (
13
), solid biomass (12 % of all RES-E) and solar PV systems (11 % of all RES-E).
All the other technologies made smaller contributions, ranging from 0.1 % (tidal, wave and ocean
energy) to 6 % (biogas).
• Over the period 2005-2017, the RES-E consumption increased by 9 percentage points per year, on
average. To achieve the expectations for 2020 in the NREAPs, an increase by 7 percentage points
per year, on average, will be required over the period 2017-2020. For 2005-2017, the increase was
the highest for solar PV systems, offshore wind, biogas and onshore wind with respectively 637,
158, 33 and 28 percentage points increase per year, on average. For the same period, hydropower
had the lowest increase with 0 percentage points per year, on average.
According to EEA early estimates, RES-E generation increased in 2018 to 90.5 Mtoe, while total electricity
generation from all sources increased to 280.7 Mtoe, resulting in a RES-E share of 32.1 %. Most of the
increase in RES-E generation in 2017 was due to the greater contribution of wind energy (+3.1 Mtoe) and
solar energy (+0.7 Mtoe). In 2017, electricity consumption in Europe increased for the third consecutive
year following the decrease in 2014.
Figure 6 RES-E in the EU
Notes: This figure shows the actual final RES-E consumption for 2005-2017, approximated estimates for 2018 and the expected
realisations in the energy efficiency scenario of the NREAPs for 2019-2020. Wind power and hydropower are normalised. The
consumption of RES accounts for only biofuels complying with the RED sustainability criteria.
Sources: ETC/CME; Eurostat, (Eurostat 2019d); NREAP reports.
(
13
) The SHARES tool contains only total offshore and onshore wind energy production. In this report, it is assumed
that offshore wind turbines realise 4 000 full load hours per year. Accordingly, onshore and offshore wind
reached each a share of 28 % and 6 % of all RES-E, respectively.
Eionet Report - ETC/CME 2019/8 19
Notes: This table shows the actual final renewable energy consumption for 2005, 2016 and 2017, approximated estimates for
2018 and the expected realisations in the energy efficiency scenario of the NREAPs for 2020. Also shown are the average
percentage point increase per year for the period 2005-2017, the percentage point increase from 2016 to 2017 and the average
percentage point increase per year required to reach the expected realisations in the NREAPs for 2020. Wind power and
hydropower are normalised.
(a) Renewable municipal waste has been included in solid biomass.
(b) The series includes all biofuels and bioliquids consumed for electricity purposes, including uncertified ones after
2011.
Sources: ETC/CME; (Eurostat 2019d); NREAP reports.
Final energy (ktoe)
Percentage increase per year
Technology
2005
2016
2017
Proxy
2018
NREAP
2020
2005 -
2017
2016 -
2017
2017 -
2020
Hydropower excl.
pumping (normalised)
29 587
30 176
30 002
30 248
31 786
0 %
-1 %
2 %
Onshore wind
(normalised)
5 667
22 483
24 374
26 017
30 303
28 %
8 %
8 %
Solid biomass (
a
)
4 473
9 713
10 041
10 211
13 460
10 %
3 %
11 %
Solar PV systems
126
9 101
9 760
10 469
7 062
637 %
7 %
-9 %
Biogas
1 105
5 443
5 515
5 599
5 493
33 %
1 %
0 %
Offshore wind
(normalised)
273
4 267
5 441
6 362
11 740
158 %
28 %
39 %
Geothermal energy
464
584
583
586
943
2 %
0 %
21 %
Concentrated solar
power
0
480
506
530
1 633
n.a.
5 %
74 %
Bioliquids (certified)
0
440
415
415
1 096
n.a.
-6 %
55 %
Tidal, wave and ocean
energy
41
43
45
48
559
1 %
5 %
381 %
Total RES-E (normalised,
certified biofuels)
42 007
82 730
86 682
90 483
104 075
9 %
5 %
7 %
Total RES-E (normalised,
including all biofuels) (
b
)
42 159
82 745
86 696
90 498
104 075
9 %
5 %
7 %
Table 2 RES-E in the EU, by RES technology

Eionet Report - ETC/CME 2019/8 20
Hydropower
Rainfall patterns determine annual changes in hydroelectricity production. That is why normalised
production data are taken into account. The normalised (
12
) production of renewable hydroelectric power
remained quite stable over the period 2005-2017, but in 2017, the normalised production of
hydroelectricity has decreased slightly, from 30.2 Mtoe in 2016 to 30.0 Mtoe as illustrated in Figure 7.
According to the NREAPs, limited growth, from 30.0 to 31.8 Mtoe, is expected for the period 2017-2020.
In 2017, the five countries with the most hydropower (Sweden, France, Italy, Austria and Spain) had a
share of 70 % of all hydropower generation in the EU. In 2018, the normalised production of
hydroelectricity is likely to increase in absolute value (from 30.0 Mtoe in 2017 to 30.2 Mtoe in 2018), but
decreasing its share (from 35 % in 2017 to 33 % in 2018).
Hydropower is a flexible, mature technology for power generation, and hydropower reservoirs (dams) can
provide energy storage. Investments in large-scale hydropower (> 10 MW) were mainly made before 2000.
Most of the best sites have already been developed (amounting to about half of the technically feasible
potential; Pedraza, 2014), which is why hydropower capacities evolve only a little across Europe. In 2018,
the largest capacities (including pumped storage) have been added in Austria, Iceland and Italy
(respectively 385, 100 and 88 MW). Much larger capacities were added outside the European Union, in
Turkey and Norway (respectively 1 085 and 419 MW) (International Hydropower Association 2019).
For large-scale hydropower (> 10 MW), the difference between expected and planned electricity
generation is relatively small compared to other RES-E technologies. Based on modelling results with
Green-X (
14
), at EU level, a relatively low underachievement, of ca. 5 % compared to the NREAP trajectory
for this technology, is expected for 2018. For 2020, it is expected that the situation remains rather the
same, with large-scale hydropower ending up below the target, with a relatively small deviation of 6.7 %.
For small scale hydropower a slight overachievement by 2018 (of 2.3 % to 3.4 %) and a slight
underachievement till low overachievement (-0.4 % to 1.3 %) by 2020 is expected (Ecofys 2019).
Hydropower projects may negatively impact the habitats where they are installed and its operation cause
mortality of several flying species (namely birds, bats, butterflies). In order to minimise such impacts, the
European Commission published guidance for use by competent authorities, developers and consultants
‘The requirements for hydropower in relation to EU Nature legislation’ (EC 2018).
(
14
) The Green-X model allows the investigation of the future deployment of RES as well as the accompanying costs
and benefits. Results are calculated at both country- and technology-level on a yearly basis. Two scenarios were
modelled: Current Policy Initiatives (CPI) and Current and Planned Policies Initiatives (CPI + PPI) (Ecofys 2019).
Eionet Report - ETC/CME 2019/8 21
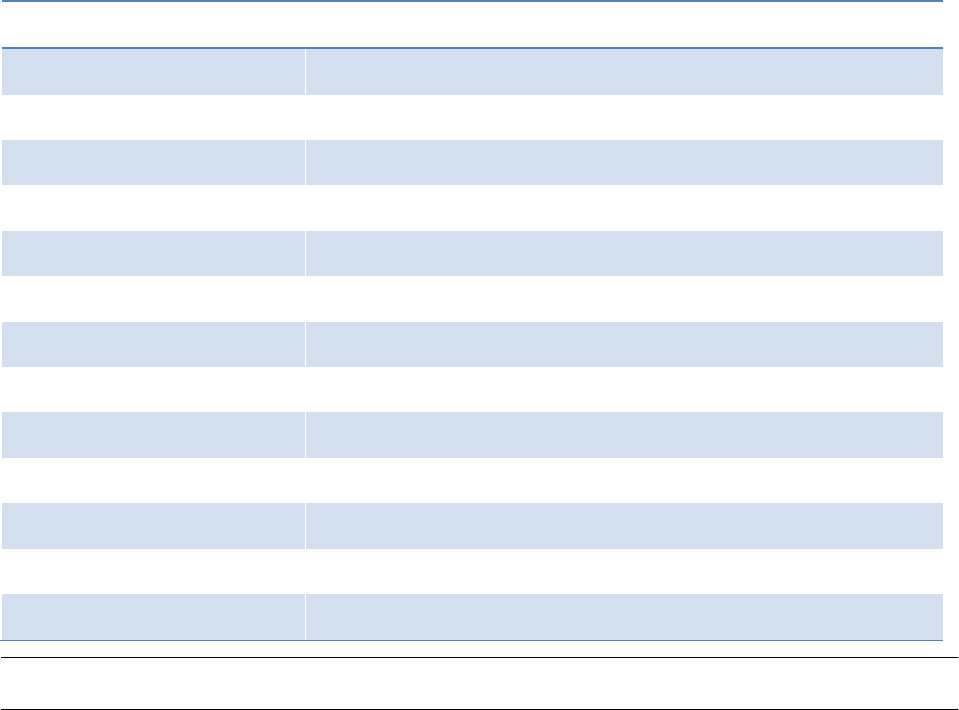
Figure 7 RES-E in EU hydropower excluding pumping (normalised)
Notes: This figure shows the actual final RES-E consumption for 2005-2017, approximated estimates for 2018 and the expected
realisations in the energy efficiency scenario of the NREAPs for 2019-2020.
Sources: ETC/CME; (Eurostat 2019d); NREAP reports.
Onshore wind
Onshore wind power generation increased from 5.7 Mtoe in 2005 to 24.4 Mtoe in 2017. The largest
increases came from Germany (6.2 Mtoe in 2017) and Spain (4.4 Mtoe in 2017).
In 2018, the normalised
(12)
onshore wind production of electricity is estimated to reach 26.0 Mtoe (Figure
8Figure 8 RES-E in the EU: onshore wind (normalised)).
Onshore wind is a rather mature and lower cost RES technology ((IRENA 2016); (Roland Berger 2016)). The
NREAPs indicate that onshore wind could increase to 30.3 Mtoe in 2020. Over the period 2005-2017
onshore wind increased by 28 percentage points per year, on average. Although an increase of
8 percentage points per year, on average, in the period up to 2020 would be sufficient to meet
expectations in the NREAPs, in reality wind power could continue to grow more rapidly until 2020, given
the cost reductions that have taken place over the past 10 years.
In 2018, the greatest annual increase in normalised onshore wind production at the Member State level
was recorded in Germany, followed by the United Kingdom and France. Germany was again the largest
installer, with 2.4 GW additional onshore capacity (not including 0.25 GW decommissioned) but this was
less than half of the 5.3 GW it installed in 2017. The main reasons for this slowdown in deployment were
the lengthy permitting procedures due, i.a., to objections resulting in legal proceedings and the fact that
a large proportion of the tender volumes has been won by ‘citizen’s projects’ that benefit from longer lead
times. France had its second best year, with 1.5 MW net installed in 2018. With its draft of a multi-year
energy programme (PPE) published at the start of 2019, France lays the foundation for investments in the
next decade (EurObserv’ER 2019; Wind Europe 2019).
Further developments on the wind energy market in general include concentration of manufacturers by
mergers and acquisitions and a thorough digitalisation of data transferring, sharing and processing to a
virtual world. According to EurObserv’ER, the general slowdown in installation rates reveals a need for
Power Purchase Agreements (PPAs), to enable wind producers to get involved in private sales contracts
directly. To follow on this aspect, the European Commission has asked Member States to set up a
regulatory framework that could promote PPAs in their forthcoming national action plans (EurObserv’ER
2019c). In 2018, 0.4 GW of wind power were decommissioned which is a decrease compared to 2017
(0.6 GW). A part of the decommissioned turbines were repowered and together with a part of
decommissioned capacity in 2017 it resulted in a total of 0.5 GW repowered capacity (Wind Europe 2019).
Eionet Report - ETC/CME 2019/8 22
Compared to the NREAP trajectory at EU level, for wind onshore a small gap in the range of 0.3 % to 5.0 %
is expected by 2018 and a similar situation by 2020 when the gap may increase to about 6.3% (Ecofys
2019).
In a number of countries, planned policy initiatives and optimistic framework conditions positively
influence progress in achievement of the sectoral trajectory. However, several other Member States are
expected to fail in achieving their trajectory but to a less significant extent and improvements related to
support as well as to market integration are required (Ecofys 2019).
To overcome the barrier of siting wind projects in such a way that they are compatible with protecting
biodiversity and Europe’s natural heritage, the European Commission developed the guidance ‘Wind
energy developments and Natura 2000’ (EC 2011))(EC 2001). It includes guidelines on how best to ensure
that wind energy developments are compatible with the provisions of the Habitats and the Birds Directives
(EC 2014).
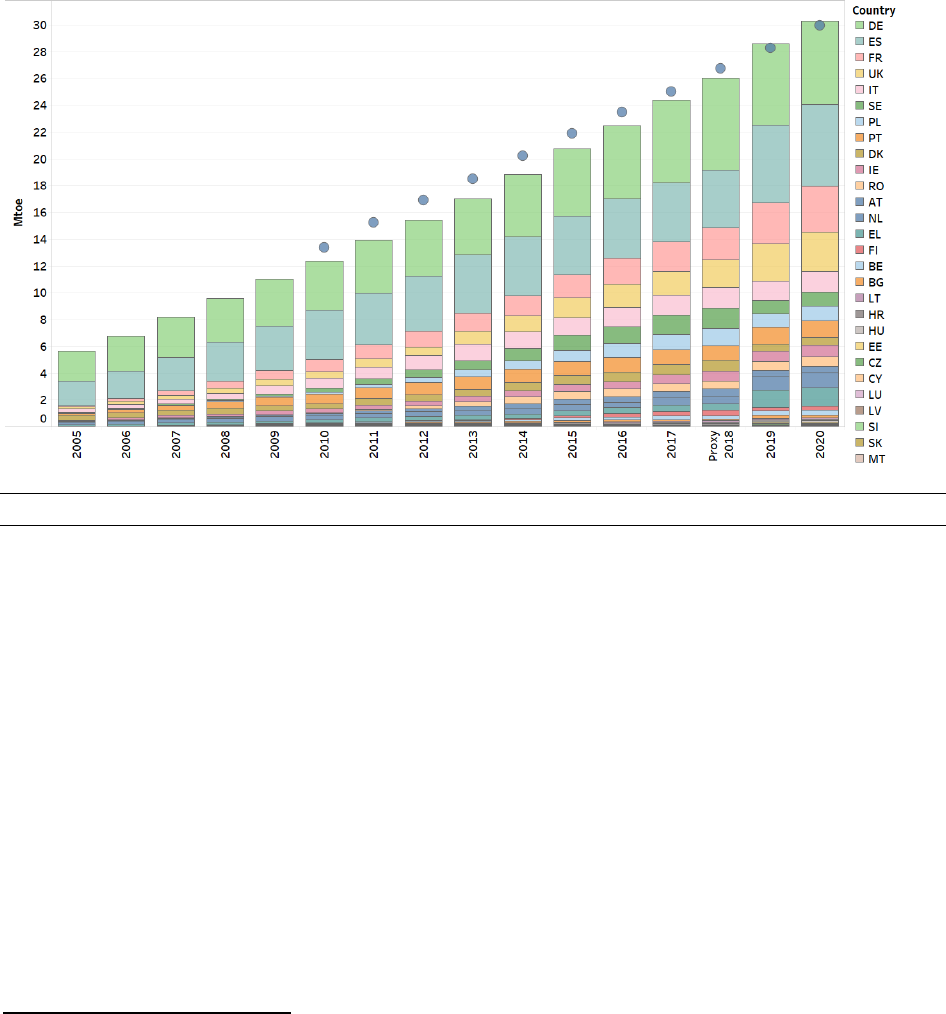
Figure 8 RES-E in the EU: onshore wind (normalised)
Notes: This figure shows the actual final RES-E consumption for 2005-2017, approximated estimates for 2018 and the expected
realisations in the energy efficiency scenario of the NREAPs for 2019-2020.
Sources: ETC/CME; (Eurostat 2019d); NREAP reports.
Solid biomass
Electricity generation from solid biomass grew from 4.5 Mtoe in 2005 to 10.0 Mtoe in 2017, driven by,
inter alia, the expansion in biomass cogeneration and the conversion of coal-fired power plants to biomass
installations (
15
). The increase per year for the period 2005-2017 was by 10 percentage points per year, on
average (Figure 9). Since 2015, the United Kingdom has surpassed Germany in total electricity generated
from solid biomass. In 2017, it accounted for 21 % of total electricity generated from solid biomass and
Germany accounted for 14 %. Finland and Sweden each had shares of 10 %. Preliminary estimates for 2018
show a slight general increase to 10.2 Mtoe.
Until 2020, the European Commission leaves it to Member States to decide whether to introduce
sustainability criteria for solid (and gaseous) biomass fuels. For the post-2020 period, the RED II, which
entered into force by the end of 2019, strengthens the existing EU criteria regarding the sustainability of
biofuels and bioliquids and extends them to the conversion of biomass and biogas to heat and power in
plants with a capacity of at least 20 MW. Default GHG emission values and calculation rules are provided
(
15
) Municipal solid waste has been included in solid biomass.
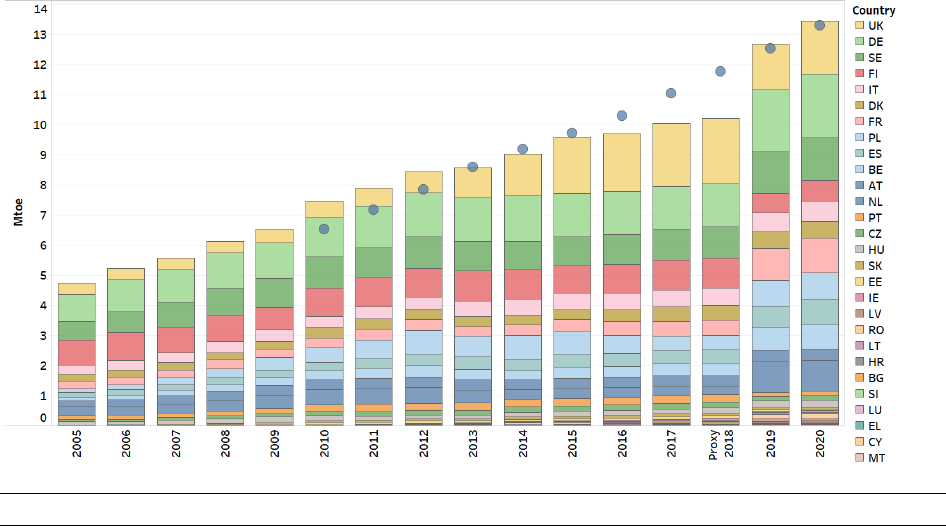
Eionet Report - ETC/CME 2019/8 23
in Annex V (for liquid biofuels) and Annex VI (for solid and gaseous biomass for power and heat
production). The RED II also includes new sustainability criteria for forestry feedstocks and requires that
harvesting takes place with legal permits, the harvesting level does not exceed the growth rate of the
forest, and that forest regeneration is ensured. Further, it requires that biofuels and bioenergy from forest
materials comply with requirements which mirror the principles from the EU Land Use, Land Use Change
and Forestry (LULUCF) Regulation (EU 2018a). The new approach is essential to address emissions from
indirect land-use change (ILUC) associated to the production of biofuels, bioliquids and biomass fuels.
For 2018, at EU-level, an underachievement of 19 % to 27 % compared to the NREAP trajectory is observed
for this technology, depending on the scenario including current policy initiatives (CPI) or current and
planned policy initiatives (CPI+PPI). Whereas for 2020 a relatively similar situation is expected: the EU
would fail to meet the target with implemented and planned support policies by 26 % to 36 % (Ecofys
2019).
To meet NREAP expectations, an increase of 11 percentage points per year, on average, in electricity
generated from solid biomass would need to be sustained over the period 2017 to 2020.
Figure 9 RES-E in the EU: solid biomass
Notes: This figure shows the actual final RES-E consumption for 2005-2017, approximated estimates for 2018 and the expected
realisations in the energy efficiency scenario of the NREAPs for 2019-2020.
Sources: ETC/CME; (Eurostat 2019d); NREAP reports.
Solar photovoltaic systems
Solar PV electricity production reached 9.8 Mtoe in 2017 (Figure 10), exceeding by more than 38 %
(2.7 Mtoe) the level that was expected for 2020, according to the NREAPs (7.1 Mtoe). In 2017, 35 % of all
solar PV electricity across the EU was generated in Germany. Italy too had a large share, 21 %, followed by
the United Kingdom, Spain and France with shares of 10 %, 8 % and 8 %, respectively.
In 2018, early EEA estimates suggest that the production of solar PV electricity increased again, overtaking
the NREAP levels for 2020 by 75 % and reaching 10.5 Mtoe.
After the slower growth in 2017 (5.7 GW) newly installed capacity soared in 2018 to 7.6 GW – an increase
by more than 30 %. The greatest increase in solar PV capacity at the Member State level was recorded in
Germany (2.9 GW), followed by the Netherlands (1.4 GW), France (862 MW), Italy (440 MW) and Hungary
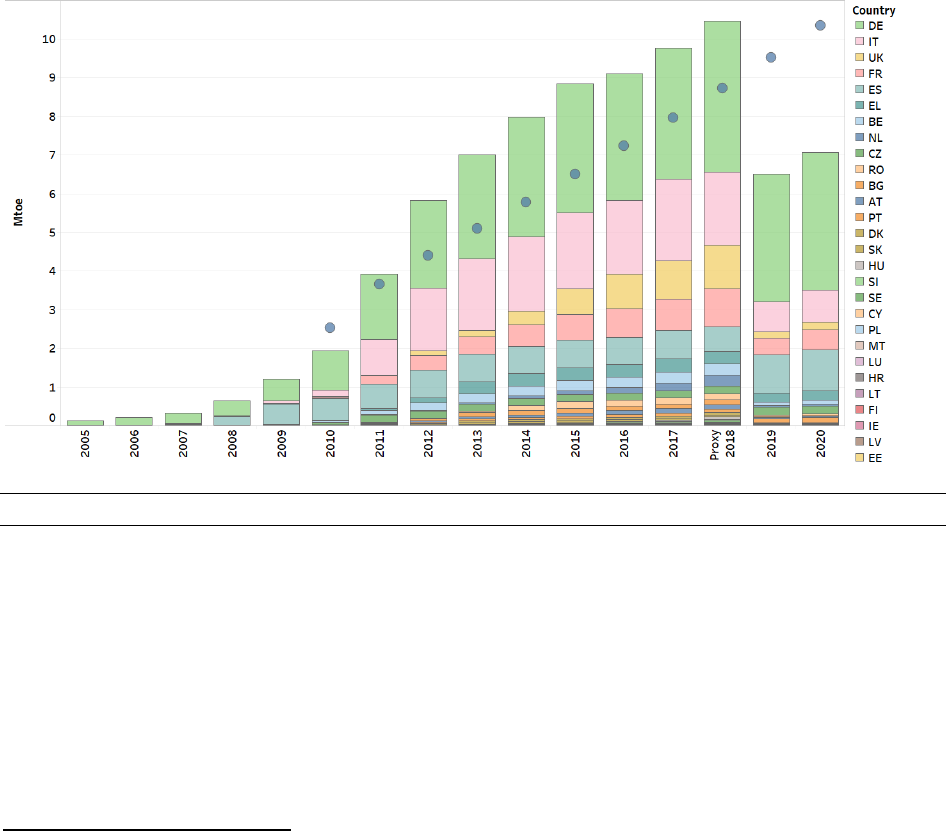
Eionet Report - ETC/CME 2019/8 24
(410 MW) (
16
). A further three Member States (Belgium, United Kingdom and Poland) added between
200 MW and 400 MW in 2017 (EurObserv’ER 2019a). Key drivers for this positive development in 2018
were the launch of a series of tenders to speed up the deployment of PV in Germany and the connection
of very high-capacity projects funded under the SDE+
17
programme in the Netherlands.
Rapid technological progress, cost reductions and the relatively short project development times are
among the key drivers for the growth of solar PV energy over the past 10 years (Ecofys 2014). After the
peak years, 2011 and 2012, the market slowed down because of increased taxes on self-consumption and
new policies reducing financial support. As a result, annually installed solar PV capacities are lower since
2011 than installation levels before this year.
For PV, the EU NREAP trajectory is overachieved in the short-term (2018) as well as by 2020 in all scenarios.
The surplus ranges from 68 % to 73 % by 2018 and from 54% to 69% by 2020. The positive impact of
planned policy initiatives on PV performance in MS like Bulgaria, Italy and Luxembourg could be noted
(Ecofys 2019).
Figure 10 RES-E in the EU: solar PV energy
Notes: This figure shows the actual final RES-E consumption for 2005-2017, approximated estimates for 2018 and the expected
realisations in the energy efficiency scenario of the NREAPs for 2019-2020.
Sources: ETC/CME; (Eurostat 2019d); NREAP reports.
Biogas
Electricity generation from biogas grew from 1.1 Mtoe in 2005 to 5.5 Mtoe in 2017 (Figure 11), reaching
the level expected for 2020 in the NREAPs (5.5 Mtoe). On average, over the period 2005-2017, the increase
for biogas was by 33 percentage points per year. At the EU level, over half of the electricity sourced from
biogas is recorded in Germany (53 %). Italy and the United Kingdom both accounted for 13 % of the EU
total.
(
16
) For 2018, capacity data for all Member States are taken from EurObserv’ER and, in some cases, they might vary
slightly from national data.
(
17
)The SDE+ (in Dutch: Stimulering Duurzame Energieproductie) is an operating grant. Producers receive financial
compensation for the renewable energy they generate. The difference in price (cost price – market price) is
called the unprofitable component. SDE+ compensates producers for this unprofitable component for a fixed
number of years, depending on the technology used. (More info: https://english.rvo.nl/subsidies-
programmes/sde)
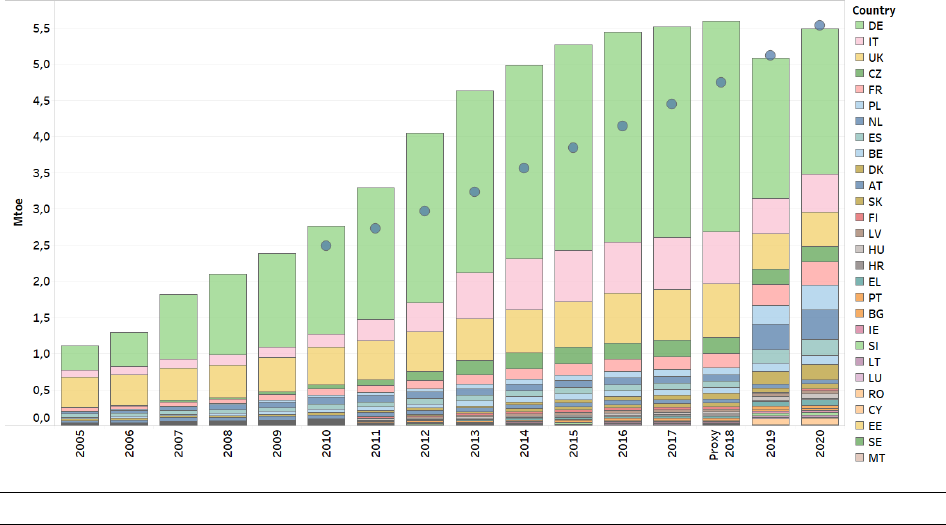
Eionet Report - ETC/CME 2019/8 25
In 2018, electricity generation from biogas increased further, according to early EEA estimates, up to 5.6
Mtoe. After strong growth in 2011 and 2012, more moderate growth could be observed in the 2013-2017
period due to policy changes to discourage the use of energy crops in Germany, Italy and the United
Kingdom. For a number of years, most of the EU’s primary biogas energy production has been taken up by
the ‘other biogas’ category, whose share has constantly risen compared with the landfill and sewage plant
biogas categories (EurObserv’ER 2017). At the European level, discussions on sustainability criteria are
similar to those concerning solid biomass.
Contrary as to electricity production from solid and liquid biomass, biogas electricity production is
expected to slightly overachieve the EU NREAP trajectories for the year 2018 by about 20 % to 22 %.
Besides well performing countries (Germany, Italy, the United Kingdom, Croatia, Austria, Finland, and the
Czech Republic), a large remainder of countries are expected to fail in meeting their planned NREAP
trajectories for biogas in 2018 (including Denmark, Greece, Cyprus, Lithuania, Malta, the Netherlands,
Romania and Slovenia). This causes a wide geographical spread with respect to the deviation from the
domestic NREAP trajectories. For 2020, a similar situation can be expected. Nevertheless, the Member
States contributing most to the aggregated electricity generation from biogas at EU-level compensate
large parts of the gap arising from other Member States. At EU-level a surplus of 9 % to 11 % can be
observed in 2020 (Ecofys 2019).
Figure 11 RES-E in the EU: biogas
Notes: This figure shows the actual final RES-E consumption for 2005-2017, approximated estimates for 2018 and the expected
realisations in the energy efficiency scenario of the NREAPs for 2019-2020.
Sources: ETC/CME; (Eurostat 2019d); NREAP reports.
Offshore wind energy
Offshore wind power grew from 0.3 Mtoe in 2005 to 5.4 Mtoe in 2017, adding approximately 1.2 Mtoe
from 2016 to 2017 (Figure 12). The largest increase in normalised offshore wind power generation at the
Member State level occurred in Germany, with a recorded increase of 0.5 Mtoe, from 2016 to 2017. In
contrast, for the Netherlands a standstill was recorded in 2017, after a substantial increase from 2015 to
2016. For the EU-28, similar as for onshore wind energy, the installation rate in 2018 slowed down.
According to preliminary estimates from EurObserv’ER, 2.7 GW of additional offshore wind capacity was
installed in 2018 in the EU, compared to 3.2 GW in 2017, which is a decrease of 16 %. New projects were
developed in the United Kingdom, Germany, Denmark, Belgium, the Netherlands, Sweden, Finland, Spain
and France (EurObserv’ER 2019c). At the EU level, more than 44 % of the total normalised electricity
generation from offshore wind power in 2018 was recorded in the United Kingdom, and Germany has
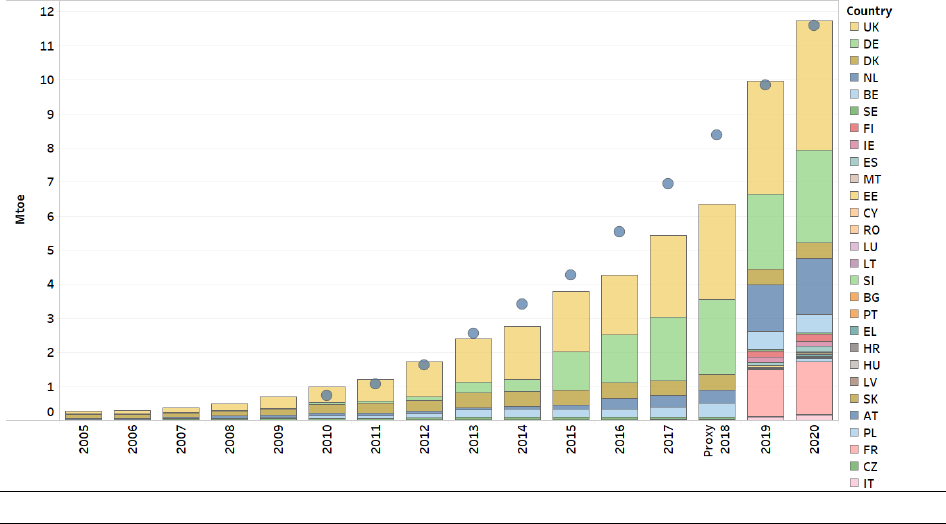
Eionet Report - ETC/CME 2019/8 26
increased its share significantly, from 13 % in 2014 to 34 % in 2018. However, compared to 2017, the share
of Germany remained stable.
According to early EEA estimates, European offshore wind generation in 2018 was 6.4 Mtoe, an increase
of 17 % compared with 2017.
Comparing the early EEA estimates for this technology to the planned trajectories for 2018 as laid down
in the NREAPs, a significant gap of about 50 % is expected at the EU-level. For 2020, this gap could be in
the range of 48 % to 59 %, depending on the scenario with the latter figure corresponding to a higher
energy demand scenario (Ecofys 2019).
Offshore wind power would need to grow to 11.7 Mtoe by 2020 to reach the expected realisations in the
NREAPs. This corresponds to an increase of 39 percentage points per year, on average, from 2017 to 2020.
To be successful, the offshore wind sector needs to deliver the objectives of the EU integrated maritime
policy’s Blue Economy agenda and comply with nature and marine-related legislation and objectives. The
guidance for siting wind projects compatible with protecting biodiversity and Europe’s natural heritage
developed by the European Commission also applies to offshore wind energy (EC 2011).
Figure 12 RES-E in the EU: offshore wind (normalised)
Notes: This figure shows the actual final RES-E consumption for 2005-2017, approximated estimates for 2018 and the expected
realisations in the energy efficiency scenario of the NREAPs for 2019-2020.
Sources: ETC/CME; Eurostat, (Eurostat 2019d); NREAP reports.
Other sources of renewable electricity
• Concentrated solar power (CSP) technology is currently only realistically applicable in southern
Europe. CSP provided 0.5 Mtoe of renewable energy in 2017, and a 5 % increase is expected in 2018.
At the end of 2018, new CSP installations with approximately 300 MW capacity were under
development in Europe, of which over two third are located in Italy (EurObserv’ER 2019b).
• Geothermal electricity grew by only 2 percentage points per year, on average, to reach 0.6 Mtoe in
2017. No significant change was expected in 2018.
• Electricity generation from tidal, wave and ocean energy remained at only 45 ktoe in 2017, and no
significant change was expected in 2018.
• Electricity production from certified bioliquids decreased by 6 % from 2016 to 2017 and remained at
a moderate level, 0.4 Mtoe, in 2017. The EEA estimates the same level of generation in 2018.
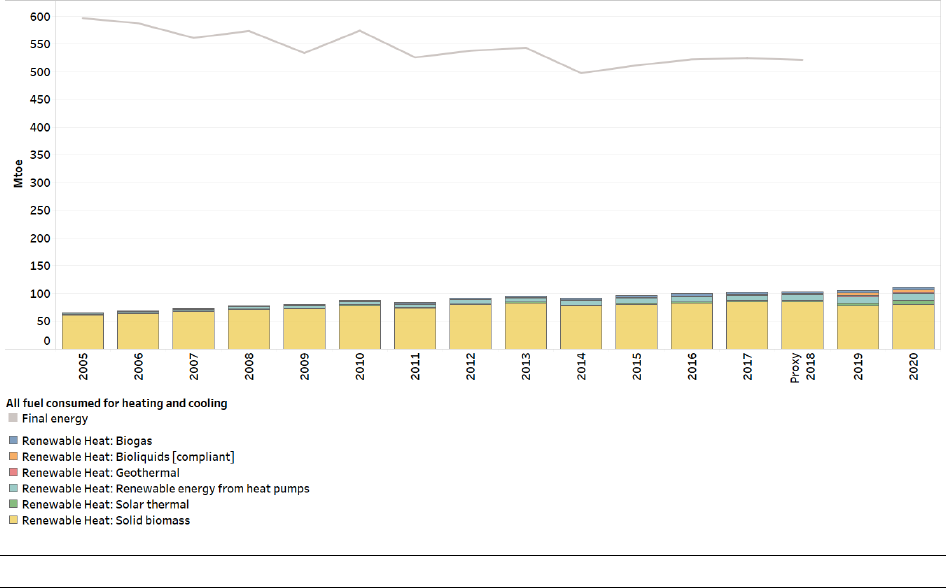
Eionet Report - ETC/CME 2019/8 27
2.2.3 Renewable heating and cooling
At the EU level, the gross final consumption of renewable energy in the heating and cooling market sector
(RES-H&C) reached a share of 19.5 % in 2017. Figure 13 and Table 3 show the development of RES-H&C
from 2005 to 2017, approximated estimates for 2018 and the expected NREAP development by 2020.
• The gross final consumption of RES-H&C was 102.2 Mtoe in 2017, which corresponds to an
increase of 2.7 Mtoe compared with 2016.
• In 2017, the largest contributions came from solid biomass (84.4 Mtoe, or 83 % of all RES-H&C),
heat pumps (10.5 Mtoe, or 10 % of all RES-H&C) and biogas (3.9 Mtoe, or 4 % of all RES-H&C).
• Over the period 2005-2017, the RES-H&C increased by 5 percentage points per year, on average.
To realise the expectations in the NREAPs for 2020, a growth rate of 3 percentage points per year,
on average , would be required over the period 2017-2020.
• According to early proxy estimates, RES-H&C increased from 102.2 Mtoe in 2017 to 103.6 Mtoe in
2018, while the amount of fuel consumed for heating and cooling decreased from 524 Mtoe to
521 Mtoe, resulting in a renewable share of heating and cooling consumption of 19.8 % in 2018.
Figure 13 RES-H&C in the EU
Notes: This figure shows the actual final RES-H&C for 2005-2017, approximated estimates for 2018 and the expected realisations
in the energy efficiency scenario of the NREAPs for 2019-2020. The consumption of RES accounts for only biofuels complying with
the RED sustainability criteria.
Sources: ETC/CME; Eurostat, (Eurostat 2019d); NREAP reports.
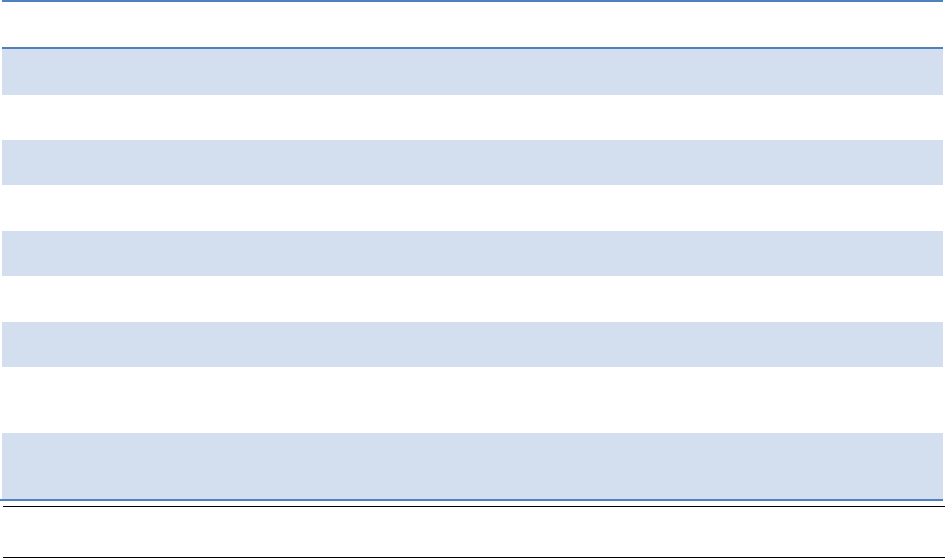
Eionet Report - ETC/CME 2019/8 28
Notes: This table shows the actual final RES-H&C for 2005, 2015 and 2017, approximated estimates for 2018 and the expected
realisations in the energy efficiency scenario of the NREAPs for 2020. Also shown are the average percentage point increase per
year for the period 2005-2017, the percentage point increase from 2016 to 2017 and the average percentage point increase per
year required to reach the expected realisations in the NREAPs for 2020. The consumption of RES accounts for only biofuels
complying with RED sustainability criteria.
(
a
) Renewable municipal waste has been included in solid biomass.
(
b
) The series includes all biofuels and bioliquids consumed for heating and cooling, including uncertified ones
after 2011.
Sources: ETC/CME; (Eurostat 2019d); NREAP reports.
Solid biomass
Solid biomass remains the largest source of renewable energy for heating (Figure 14) and in 2017 it
exceeded the NREAP levels expected for 2020 for the second consecutive year. The consumption of
renewable heat originating from solid biomass increased from 82.8 Mtoe in 2016 to 84.4 Mtoe in 2017.
Heat from solid biomass increased by 3 percentage points per year, on average, over the period 2005-
2017. In 2018, the consumption of solid biomass for renewable heat increased to 85.4 Mtoe, according to
the early EEA estimate, exceeding the expected NREAP level for 2018 by 11.1 Mtoe.
The amount of heat from solid biomass directly used by final consumers across the EU increased very little
in 2017 (by 1 % over 2016 levels) while heat from solid biomass sold to heating networks increased faster
(by 4.1 %), in particular in Finland, Denmark and Sweden, countries with proactive biomass cogeneration
policies.
The new Renewable Energy Directive (RED II) (EU 2018a) has introduced sustainability requirements also
for solid and gaseous bioenergy, in order to ensure robust GHG emission savings and to minimize
unintended environmental impacts from this energy source. It contains a new approach to address
emissions from indirect land-use change (ILUC) caused by the production of biofuels, bioliquids and
biomass fuels. Therefore, it sets national limits, which will gradually decrease to zero by 2030 at the latest,
for high ILUC-risk biofuels, bioliquids and biomass fuels produced from food or feed crops. These limits will
affect the amount of these fuels that can be taken into account when calculating the overall national share
of renewable energy sources and the share of renewables in transport. However, the RED II also introduces
an exemption from these limits for biofuels, bioliquids and biomass fuels that are certified as low ILUC-risk
(EC 2019c).
Final energy (ktoe)
Percentage point increase per year
Technology
2005
2016
2017
Proxy
2018
NREAP
2020
2005-
2017
2016-
2017
2017-
2020
Solid biomass (
a
)
61 700
82 784
84 431
85 372
80 886
3 %
2 %
-1 %
Renewable energy
from heat pumps
2 285
9 930
10 467
10 615
12 289
30 %
5 %
6 %
Biogas
744
3 586
3 918
4 085
5 108
36 %
9 %
10 %
Solar thermal
698
2 169
2 307
2 411
6 455
19 %
6 %
60 %
Geothermal
560
777
829
870
2 646
4%
7 %
73 %
Bioliquids
(certified)
0
224
237
241
4 416
n.a.
6 %
588 %
Total renewable
heat (certified
biofuels)
65 987
99 470
102 189
103 594
111 801
5 %
3 %
3 %
Total renewable
heat (including all
biofuels) (
b
)
66 156
99 656
102 345
103 759
111 801
5 %
3 %
3 %
Table 3 RES-H&C in the EU
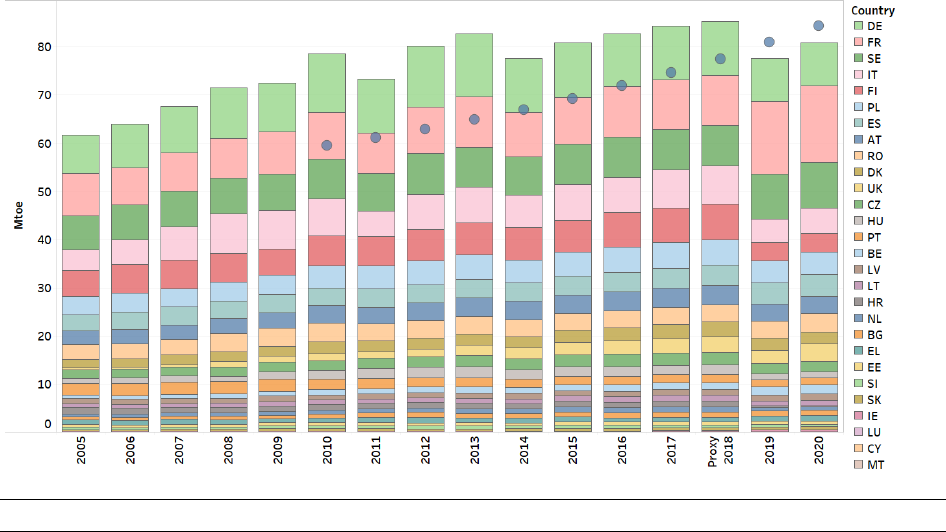
Eionet Report - ETC/CME 2019/8 29
The consumption of biomass in the EU in 2018 will slightly outperform compared to the indicative NREAP
trajectory. Also for 2020 the overall positive trend is expected to remain, with a range between a gap of
0.3% and a surplus of 6.8% (Ecofys 2019).
With the rising consumption of solid biomass as a renewable heating fuel, the sustainability of the current
and future supply of the resource was the focus of two recent EU-financed studies (PWC et al 2017); (COWI
et al 2018). According to one of the studies, solid biomass for energy is largely supplied from North
America, Russia and within the EU (COWI et al 2018). Although about 88 % of biomass feedstock from
within Member States was consumed close to the production source, net imports of bioenergy (solid
biomass, biofuels) play a role and stood at 5.4 Mtoe in 2014, of which 5 % was ethanol, 9 % biodiesel, 48 %
wood pellets and 37 % other wood fuels (PWC et al., 2017). The intra-EU trade in wood pellets amounted
to 2.2 Mtoe in 2014, but it is projected to increase according to the study to 11.6 Mtoe by 2030, exceeding
the projected 2030 extra-EU import of 10.3 Mtoe (PWC et al 2017).
Figure 14 RES-H&C in the EU: solid biomass
Notes: This figure shows the actual final RES-H&C for 2005-2017, approximated estimates for 2018 and the expected realisations
in the energy efficiency scenario of the NREAPs for 2019-2020.
Sources: ETC/CME; Eurostat, (Eurostat 2019d); NREAP reports.
Heat pumps
Renewable energy from heat pumps grew from 2.3 Mtoe in 2005 to 10.5 Mtoe in 2017 (Figure 15). In
northern Europe, most heat pumps are used for heating, but elsewhere there is also a market for cooling.
In 2017, Italy contributed 25 % to final EU-wide RES consumption from heat pumps. France (22 %), Sweden
(13 %) and Germany (10 %) also made significant contributions.
More than 3.5 million systems were sold in 2017 in the EU, which amounts to a 4.4 % increase compared
to 2016. However, in relative terms this is less than the growth rates recorded in 2015 and 2016 (20 % and
26 %, respectively), and can be explained by the downturn in the Italian market where cooling needs are
the key driver. Around one third of the sold systems are primarily intended for heating (1.1 million
according to the European Heat Pump Association). The remaining two-thirds are used for cooling in
Southern European countries (EurObserv’ER 2018a).
Reversible air-to-air heat pumps continue to lead sales (3.1 million units in 2017), being the preferred
choice in home renovations. Among the EU Member States, Italy has still recorded the highest sales of
heat pumps in 2017 (1.44 million units), followed by Spain (912 000) and France (487 000). Traditionally
heat pumps are installed in newly constructed buildings. However, recent technological developments
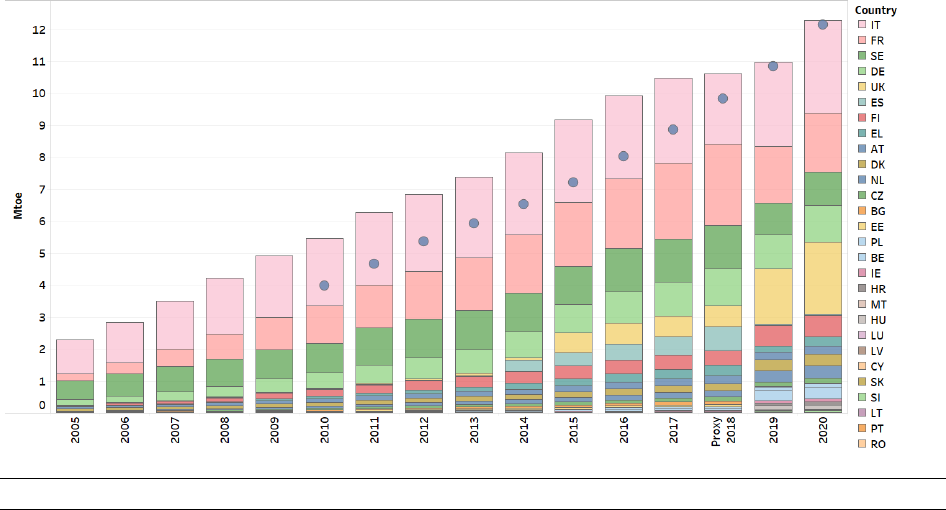
Eionet Report - ETC/CME 2019/8 30
contributed to higher supplied temperatures, which also make them a solution for the renovation of the
existing housing stock. For the moment, the heat pump market share in renovation is rather moderate
(less than 10 %, depending on the country) and that is why a significant potential for growth for heat
pumps in this sector can be expected over the coming years.
For 2018, the exceptionally good past performance in some Member States created also at EU-level a
significant surplus compared to the NREAP indicative trajectory, in the range of 40% to 43%. For 2020, a
similar situation can be observed and even though for a large number of Member States a deficit is
projected, the EU as a whole is again expected to surpass the combined indicative 2020 trajectory (Ecofys
2019).
In 2018, renewable heat from heat pumps increased to 10.6 Mtoe, according to early EEA estimates. With
an increase of 30 percentage points per year, on average, over the period 2005-2017, the expectations in
the NREAPs continue to be exceeded for 2017, as in previous years. A 6 percentage point increase per
year, on average, would be sufficient to meet the expected contribution from heat pumps by 2020,
according to the NREAPs.
Figure 15 RES-H&C in the EU: renewable energy from heat pumps
Notes: This figure shows the actual final RES-H&C for 2005-2017, approximated estimates for 2018 and the expected realisations
in the energy efficiency scenario of the NREAPs for 2019-2020.
Sources: ETC/CME; Eurostat, (Eurostat 2019d); NREAP reports.
Solar thermal energy
The production of renewable heat from solar thermal technology realised an increase of 19 percentage
points per year, on average, over the period 2005-2017, growing from 0.7 Mtoe in 2005 to 2.3 Mtoe in
2017 (Figure 16). However, despite a further estimated increase to 2.4 Mtoe in 2018, solar thermal energy
has not been able to meet the expectations of the NREAPs.
Solar thermal collectors ‘harvest’ heat from the sun for hot water or space heating. After a decade of
declining growth pace, the solar thermal market for hot water production and heating applications in the
EU returned to increasing growth pace, as it grew from a total surface of 2 million m
2
in 2016 to 2.2 million
m
2
in 2017 (by 8.4 %). However, the amounts of growth vary by country and market segment. The largest
increases were realised in Poland, Greece and Spain. Another potential boost is the design of new systems
identified in a number of countries (Denmark, Germany, Austria, Spain and France) which consists of
collector surface connected to heating networks (EurObserv’ER 2019b).
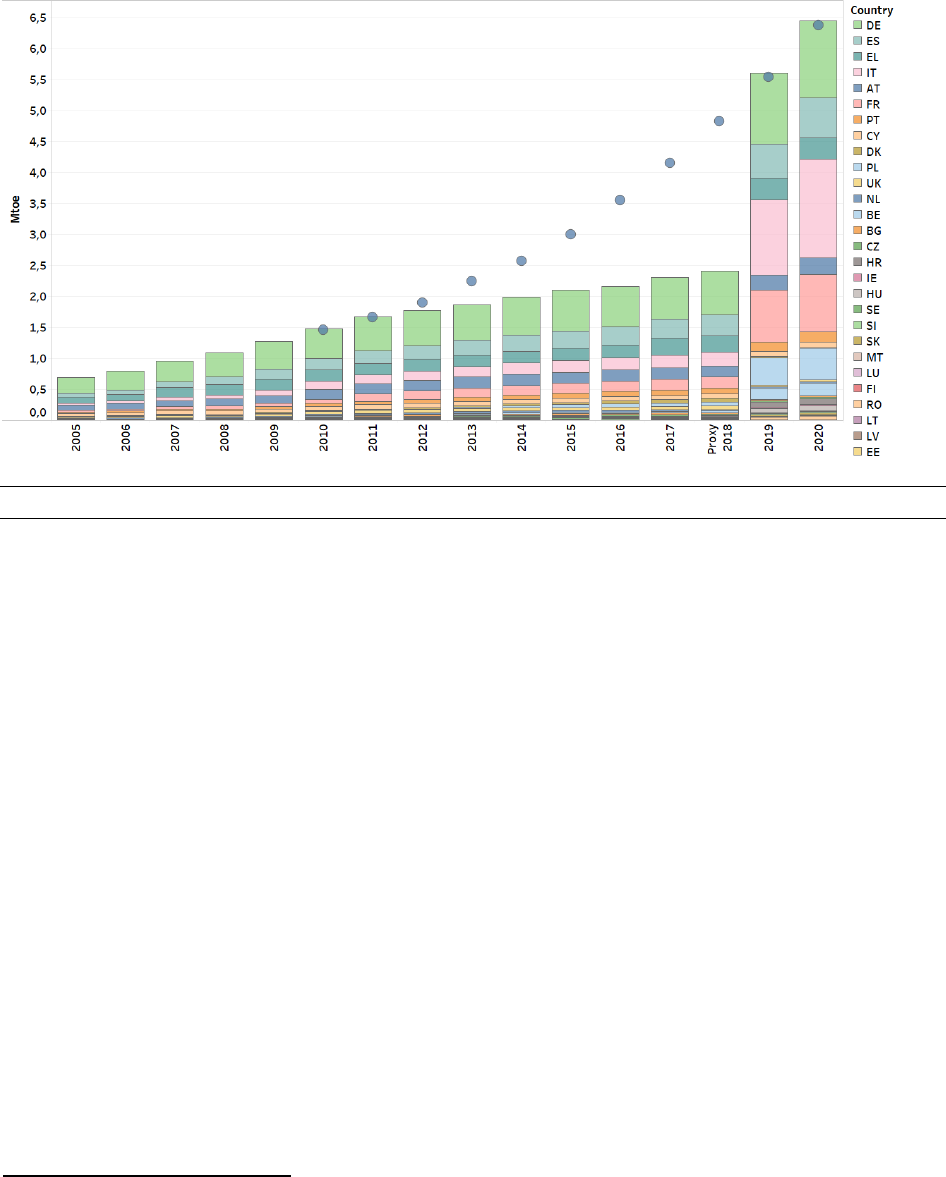
Eionet Report - ETC/CME 2019/8 31
For 2018, the expected performance is estimated to be more than 40 % lower than the indicative NREAP
trajectory. For 2020 a similar trend can be observed with underperformance of by about 43 % to 58 %
(Ecofys 2019).
Figure 16 RES-H&C in the EU: solar thermal energy
Notes: This figure shows the actual final RES-H&C for 2005-2017, approximated estimates for 2018 and the expected realisations
in the energy efficiency scenario of the NREAPs for 2019-2020.
Sources: ETC/CME, (Eurostat 2019d); NREAP reports.
Other sources of renewable heating and cooling
• Renewable heat from biogas grew from 0.7 Mtoe in 2005 to 3.9 Mtoe in 2017. According to EEA
estimates, it reached 4.1 Mtoe in 2018.
• Geothermal heat will have to bridge a large gap if it is to achieve the target of 2.6 Mtoe anticipated
for 2020. In 2017, the production of geothermal heat was 0.8 Mtoe, the substantial growth in 2016
(+12 % compared to 2015) again slowed down in 2017 (+7% compared to 2016).
• The production of heat from liquid biofuels was 0.2 Mtoe in 2017.
2.2.4 Renewable transport fuels
The share of RES-T(
18
) in the EU was 7.6 % in 2017. Figure 17 and Table 4 show the development of the use
of biofuels in transport up to 2017, approximated estimates for 2018 and their expected NREAP
development by 2020.
• The gross final consumption of certified biofuels was 14.8 Mtoe in 2017, which is a 12 % increase
compared with 2016.
• According to proxy estimates, the RES-T share grew from 7.6 % in 2017 to 8.1 % in 2018.
• To realise the expectations in the NREAPs for 2020, an increase of 32 percentage points per year,
on average, would be required over the remainder of the period 2017-2020.
(
18
) RES-T shares are sourced from the Eurostat SHARES Results 2017; absolute values are from the nrg_bal_c
Eurostat dataset.

Eionet Report - ETC/CME 2019/8 32
The use of RES-E in road transport in the EU was 40.4 ktoe in 2017, an increase by almost a quarter from
32.8 ktoe in 2016, and is estimated to be 46.5 ktoe in 2018. The amount of RES-E used in other transport
modes was almost 1.9 Mtoe (
19
) in 2017 and is estimated to overcome 1.9 Mtoe in 2018.
Figure 17 RES-T in the EU: biofuels
Notes: This figure shows the actual final RES-T for 2005-2017, approximated estimates for 2018 and the expected realisations in
the energy efficiency scenario of the NREAPs for 2019-2020. The consumption of RES accounts for only biofuels complying with
the RED sustainability criteria.
Sources: ETC/CME; (Eurostat 2019d); NREAP reports.
From 2005 to 2010, the gross final consumption of biofuels increased strongly from 3.2 Mtoe to 12.8 Mtoe
(all biofuels including non-compliant ones), followed by a moderate increase to 13.8 Mtoe in 2012 and
then more or less plateaued until 2016 to increase again moderately in 2017 to 14.9 Mtoe (Figure 18). The
EEA estimates that the use of biofuels in transport was 17.0 Mtoe in 2018. Most countries’ consumption
of biofuels is below the expected realisations in their NREAPs, but there is no clear EU-wide trend.
The transport sector has a separate RES target for 2020, which is equal to a 10 % share of renewable energy
consumption in each Member State.
The RED (EU 2009) included sustainability criteria for biofuels that can be accounted towards the national
targets. These criteria include minimum greenhouse gas emission savings and that raw materials for
biofuels must not come from certain land areas, to avoid adverse environmental effects. For social and
economic sustainability, it is requested that Member States report every two years to the European
Commission on inter alia the impact on food prices, land rights, and ratification of main producer countries
of international labour conventions. Since 2010, the share of non-certified biofuels decreased sharply,
from 37 % in 2011 to 1 % in 2017.
Concerns about the sustainability, and direct and indirect land use of first-generation biofuels led to a
reconsideration of the role of food-based biofuels (Kampman et al. 2015). To reduce indirect land use
impacts owing to biofuels and bioliquids, the Indirect Land Use Change (ILUC) Directive of 2015 (EU 2015a)
attempted to tackle — among other things — these concerns. It limited the share of biofuels from crops
(
19
) This RES-E is produced by the energy technologies discussed in Section 2.2.2.
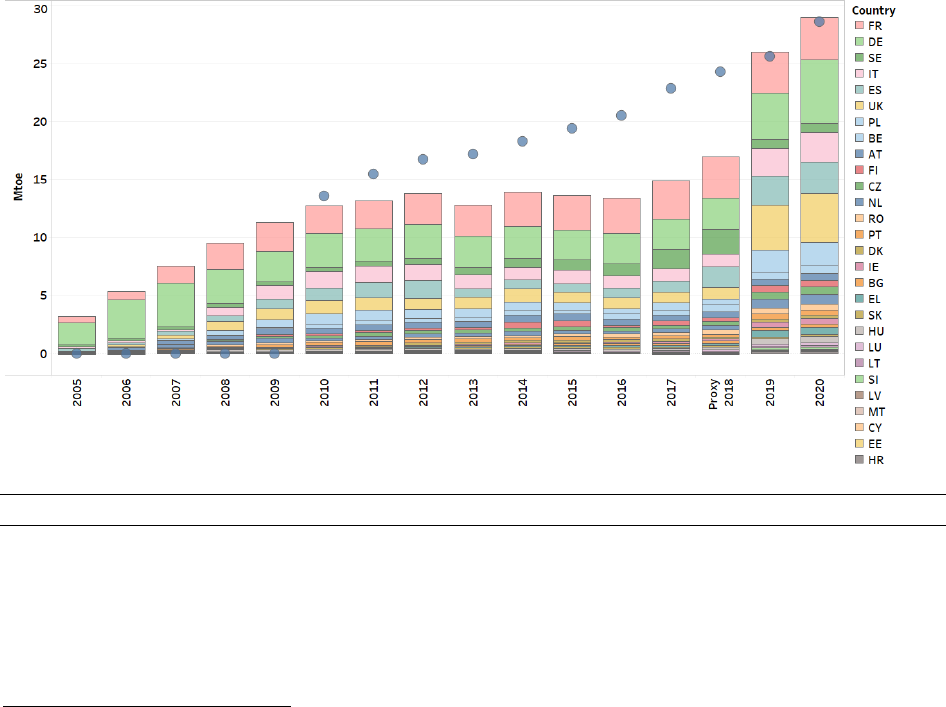
Eionet Report - ETC/CME 2019/8 33
grown on agricultural land to 7 % and obliged Member States to establish indicative national targets for
advanced biofuels (second/third generation) for 2020, with a reference value of 0.5 %. Annex IX of the
ILUC Directive also harmonised the list of feedstocks whose contribution would count double towards the
2020 national target of a 10 % share of RES-T. For electricity produced from RES and consumed by electric
road vehicles and rail transport, the ILUC Directive increases the multiplier factors for calculating the
market share of RES-T. It increased the minimum reduction threshold for GHG emissions applied to
biofuels produced in new installations, and it obliged fuel suppliers to report annually the provisional mean
values of the estimated ILUC emissions from biofuels traded (EU 2015b). The RED II (EU 2018a) further
limits the use of high ILUC-risk biofuels, produced from food and feed crops that have a significant global
expansion into land with high carbon stock such as forests, wetlands and peatlands. These additional
requirements will affect the amount of fuels that Member States can take into account for their overall
national share of renewables and the share of renewables used in transport. Member States still can use
(and import) fuels covered by these limits, but these fuels will not be counted towards the national
renewable energy targets, nor will they be entitled to receive any form of financial support. The
requirements consist of a freeze at 2019 levels for 2021-2023 and the levels will gradually decrease from
the end of 2023 to zero by 2030.
Compared to the indicative NREAP trajectories the EU will underperform both for 2018 and 2020. Only
Sweden, Austria and Hungary will reach their indicative trajectories for 2018 and 2020 while for Slovakia
and Latvia there could be either a gap or a surplus feasible, depending on the Green-X scenario
(
20
)
, by 2018
and for 2020. This list of countries with ambiguous performance is complemented with France and
Lithuania for 2020 (Ecofys 2019).
Figure 18 RES-T in the EU: biofuels including non-certified biofuels
Notes: This figure shows the actual final RES-T for 2005-2017, approximated estimates for 2018 and the expected realisations in
the energy efficiency scenario of the NREAPs for 2019-2020.
Sources: ETC/CME; (Eurostat 2019d); NREAP reports.
(
20
) The Green-X model allows the investigation of the future deployment of RES as well as the accompanying
costs and benefits. Results are calculated at both country- and technology-level on a yearly basis. Two scenarios were
modelled: Current Policy Initiatives (CPI) and Current and Planned Policies Initiatives (CPI + PPI) (Ecofys 2019)
Eionet Report - ETC/CME 2019/8 34
Final energy (ktoe)
Percentage point increase per year
Technology
2005
2016
2017
Proxy
2018
NREAP
2020
2005-
2017
2016-
2017
2017-
2020
Biodiesels (all)
2 454
10 643
11 961
13 664
20 920
32 %
12 %
25 %
Biogasoline (all)
594
2 650
2 778
3 131
7 324
31 %
5 %
55 %
Other biofuels
(all)
155
136
151
184
746
0 %
11 %
131 %
Certified
biofuels
0
13 255
14 799
16 711
28 989
n.a.
12 %
32 %
All biofuels
3 203
13 429
14 890
16 979
28 989
30 %
11 %
32 %
Table 4 RES-T in the EU: biofuels
Notes: This table shows the actual final RES-T for 2005, 2015 and 2017 (based on Eurostat nrg_bal_c data), approximated
estimates for 2018 and the expected realisations in the energy efficiency scenario of the NREAPs for 2020. Also shown are the
average percentage point increase per year for the period 2005-2017, the percentage point increase from 2016 to 2017 and the
average percentage point increase per year required to reach the expected realisations in the NREAPs for 2020. The consumption
of RES accounts for only biofuels complying with RED sustainability criteria.
Sources: ETC/CME; (Eurostat 2019d); NREAP reports.

Eionet Report - ETC/CME 2019/8 35
3 Impacts on fossil fuel consumption, greenhouse gas emissions and air pollutant
emissions
Key messages
The increased consumption of renewable energy in 2017 compared with 2005 levels allowed the EU in 2017 to:
• reduce its total GHG emissions by 502 MtCO2, equivalent to 10% of total EU GHG emissions;
• improve energy security by cutting demand for fossil fuels by 156 Mtoe, or roughly 12 % of total EU fossil fuel
consumption;
• improve energy efficiency by reducing the EU’s primary energy consumption by 41 Mtoe, equivalent to a
2.5 % reduction in primary energy consumption across the EU;
• reduce the emissions for NOx and SO2 by 46 kt and 159 kt, respectively.
Along with energy efficiency, renewable energy is a key decarbonisation pillar of Europe’s transition to a
low-carbon economy and society. Delivering the commitments under the Paris Agreement will require the
EU to cut its GHG emissions by 80 % to 95 % by 2050 (compared with 1990 levels) and to decarbonise the
energy generation sector almost completely.
The EU’s renewable energy targets are already one important part of the combined efforts to decarbonise
the energy system. Progressing towards them will effectively displace fossil fuels and complement the
other climate mitigation efforts. As improvements in energy efficiency gradually reduce our consumption
of energy, the growing share of renewables results in a progressively larger displacement of non-
renewable energy alternatives.
To date, the consumption of RES has steadily increased, both as a share of final energy consumption and
in absolute numbers. The growth of renewable energy in the mix has already eroded market shares
previously held by non-renewable sources, effectively reducing CO
2
emissions.
The following sections estimate the gross effect (
21
) of renewable energy on fossil fuel consumption and
its associated GHG emissions and then — statistically — on primary energy consumption (
22
). The relative
reductions in fossil fuel use and GHG emissions (
23
) are obtained by comparing actual growth in renewable
energy since 2005 with a counterfactual scenario in which this growth would come from non-renewable
energy sources. Effectively, this assumes that the growth in renewable energy since 2005 has substituted
an equivalent amount of energy that would have been supplied by a country-specific mix of conventional
sources. The approach takes into account neither life-cycle emissions nor carbon accounting. The method
(
21
) The term ‘gross’ describes the theoretical character of the effects estimated in this way. The potential
interactions between renewable energy deployment and the need to reduce GHG emissions under the EU-wide
cap set by the Emissions Trading System (EU ETS), as well as wider interactions with the energy and economic
system, were not modelled.
(
22
) Primary energy consumption (Europe 2020-2030), compiled by Eurostat. See 1.2.2.
(
23
) These concern the relative reduction in primary and gross inland consumption of fossil fuels, and the reduction
in total GHG emissions including international aviation but excluding LULUCF. Definitions of primary and gross
inland energy consumption are provided in the glossary. Note that, according to what has been written in 1.2.2,
the primary and gross inland consumption of fossil fuels have been retrieved from Eurostat (codes PEC and GIC).
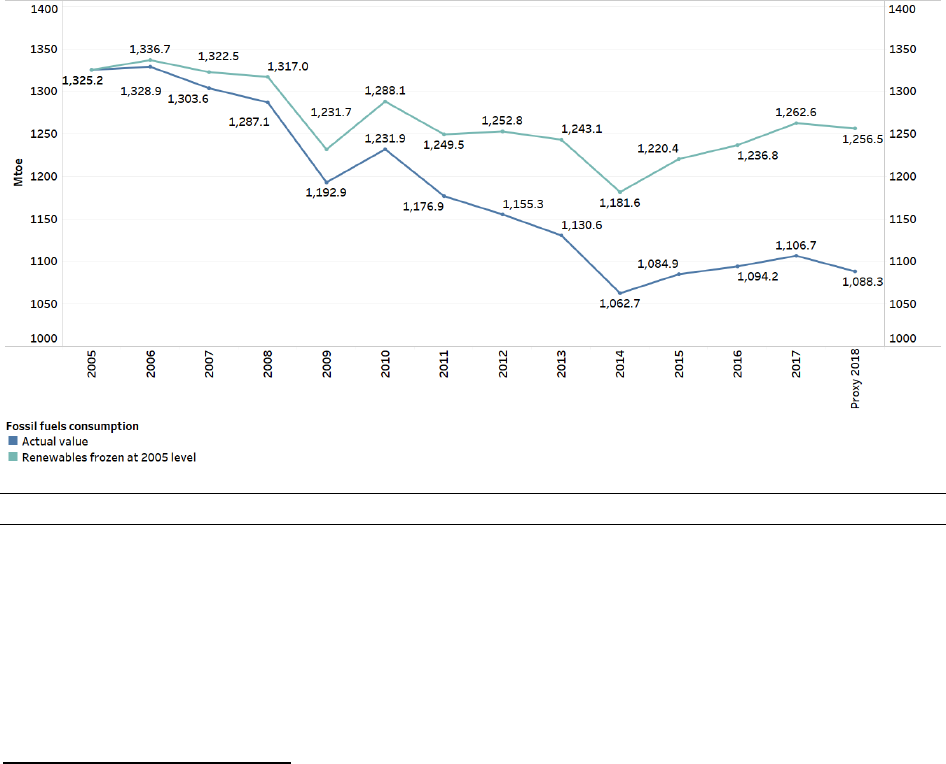
Eionet Report - ETC/CME 2019/8 36
is described in detail in the EEA report Renewable energy in Europe — Approximated recent growth and
knock-on effects (EEA 2015).
3.1 Avoided fossil fuel use
3.1.1 Effects at the EU level
The increase in the use of renewable energy compared with the level of RES consumption in 2005 allowed
the EU to cut its demand for fossil fuels by 156 Mtoe in 2017 (more than 12 % of total primary fossil fuel
consumption) (
24
), as shown in Figure 19. This amount is higher than the fossil fuel consumption of the
United Kingdom. The largest reductions were made in the consumption of gaseous fuels (58 Mtoe,
representing 37 % of all avoided fossil fuels) and solid fuels (56 Mtoe, representing 36 % of all avoided
fossil fuels).
Estimates by the EEA show that avoided fossil fuel consumption will further increase from 156 Mtoe in
2017 to 168 Mtoe in 2018, which is more than 13 % of total primary fossil fuel consumption (
25
) (see Table
5).
Figure 19 Estimated effect on fossil fuel consumption in the EU
Notes: This figure shows the effect on primary energy consumption of fossil fuels due to the increase in renewable energy
consumption since 2005 (excluding non-energy uses).
Sources: ETC/CME; (Eurostat 2019a; 2019d).
(
24
) Eurostat’s “Primary Energy Consumption” (coded PEC) indicator, because the data refer to a specific fuel group.
This is equivalent to an 11 % reduction when the effects are calculated in proportion to the EU gross inland
consumption of fossil fuels (retrieved from Eurostat’s “Gross Inland Consumption” (coded GIC). Primary energy
consumption is gross inland consumption, excluding all non-energy use of energy carriers. The RES effects were
estimated with respect to primary energy consumption, given the availability of EEA early estimates for 2018 for
primary energy consumption but not for gross inland consumption.
(
25
) Eurostat’s “Primary Energy Consumption”. See 1.2.2.
Eionet Report - ETC/CME 2019/8 37
Fuel type
2005
2010
2015
2016
2017
Proxy 2018
Solid fuels
0
-19
-59
-54
-56
-61
Gaseous fuels
0
-25
-41
-51
-58
-61
Petroleum
products
0
-12
-21
-22
-25
-26
Petrol
0
0
-2
-3
-3
-3
Diesel
0
0
-10
-11
-12
-14
Non-
renewable
waste
0
0
-2
-2
-2
-2
Total
0
-56
-136
-143
-156
-168
Table 5 Estimated effect on fossil fuel consumption in the EU (Mtoe)
Notes: This table shows the estimated effect on primary energy consumption from fossil fuels (excluding non-energy uses) of the
increase in renewable energy consumption since 2005.
Sources: ETC/CME; (Eurostat 2019a; 2019d).
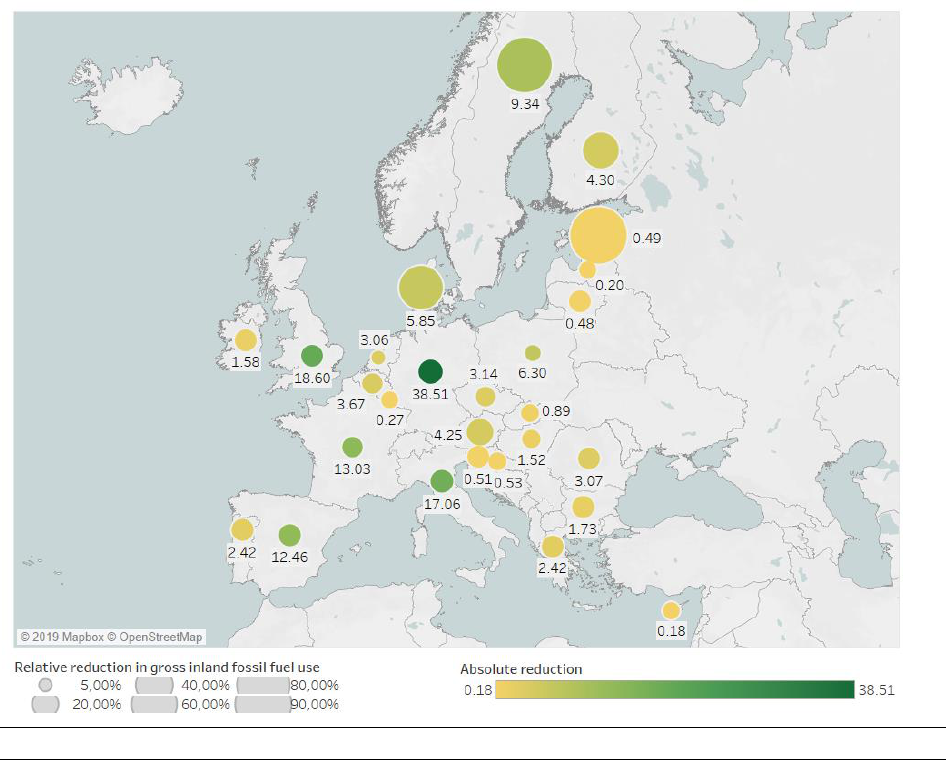
Eionet Report - ETC/CME 2019/8 38
3.1.2 Effects at the Member State level
The increase in renewable energy consumption in the Member States since 2005 has also had an impact
on fossil fuel use and GHG emissions in the countries themselves. According to EEA calculations, in 2017,
the largest relative reductions in the consumption of fossil fuels were made by Estonia (44%), Sweden
(40%) and Denmark (34%), in proportion to their gross domestic fossil fuel use. In absolute terms, the
greatest quantities of fossil fuels were avoided in Germany, the United Kingdom and Italy, where most
renewable energy was consumed (Figure 20).
Figure 20 Total and relative reduction in gross inland fossil fuel use (per year, in 2017)
Sources: ETC/CME; (Eurostat 2019a; 2019d)
3.2 Gross avoided greenhouse gas emissions
3.2.1 Effects at the EU level
In 2017, total GHG emissions (including international aviation but excluding LULUCF) in the EU were 4 384
MtCO2. According to the EEA, the growth in the consumption of renewable energy after 2005 resulted in
an estimated 502 Mt of gross avoided CO2 emissions at the EU level annually in 2017, delivering a gross
reduction of 10 % of the EU’s total GHG emissions in 2017 (frozen at 2005 level). Compared with 2016, this
effect increased by 38.3 Mt (see Figure 21).
The estimated reduction in GHG emissions due to renewables in 2017 was similar to the total GHG
emissions of the United Kingdom in 2017. The contribution from RES-E (365 MtCO2, or 73 % of all gross
avoided emissions) was considerably larger than that of RES-H&C (91 MtCO2, or 18 % of all gross avoided
emissions) and biofuels in transport (45 MtCO2, or around 9 % of total gross avoided emissions), as the
increase in RES-E led to the strongest substitution of solid fuels — the most carbon-intensive fossil fuels
— in the power sector. On the one hand, this testifies to the more rapid progress achieved since 2005 in
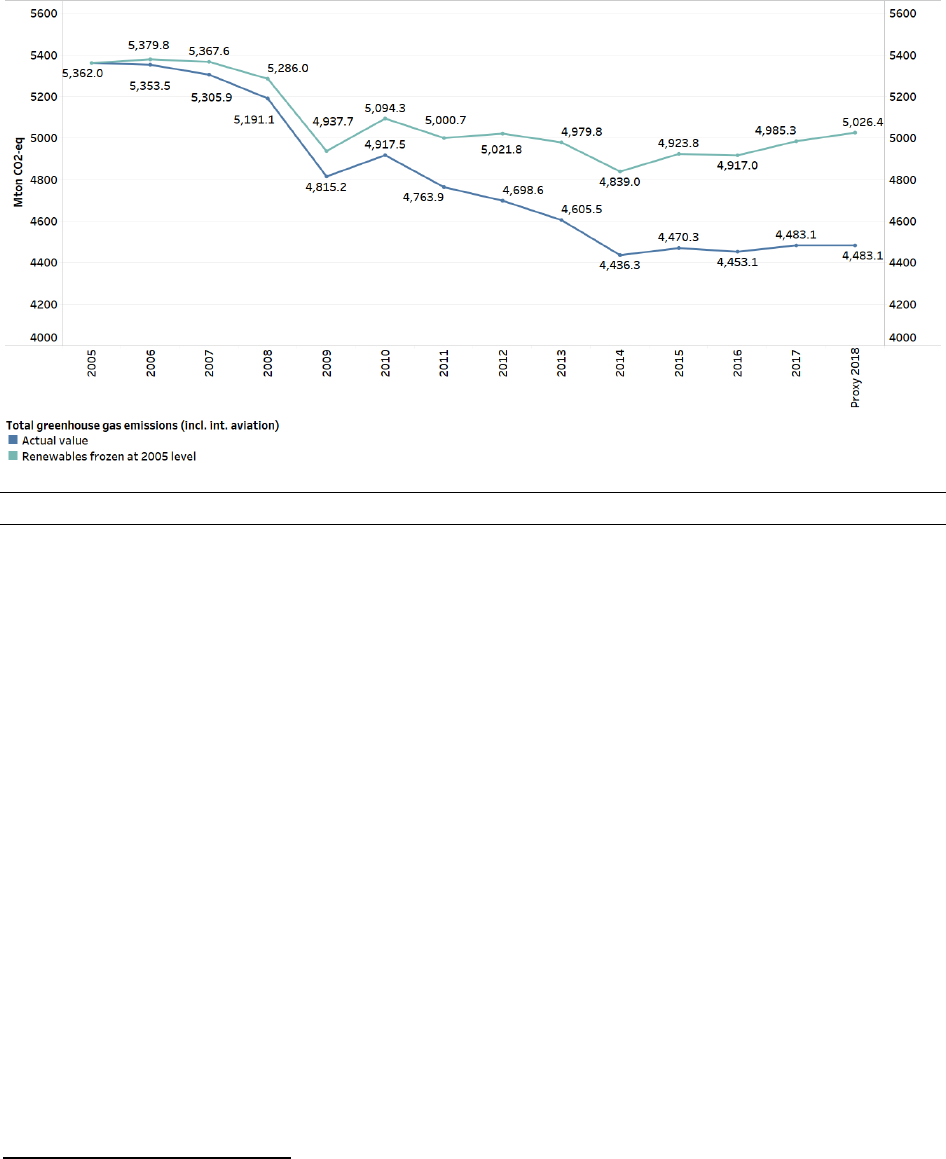
Eionet Report - ETC/CME 2019/8 39
decarbonising the EU power sector, compared with transport, heating and cooling, and industry. On the
other hand, it hints at the increasing role that RES-E could play in decarbonising other end-use sectors. It
also makes clear that a renewed focus on reducing GHG emissions in end-use sectors is necessary.
Figure 21 Estimated gross effect on GHG emissions in the EU
Notes: This figure shows the estimated gross reduction in total GHG emissions (including international aviation but excluding
LULUCF) due to the increase in renewable energy consumption since 2005.
Sources: ETC/CME; (Eurostat 2019a; 2019d).
As shown in Figure 22 and Table 6, the gross avoided emissions within the Emissions Trading System (ETS)
were estimated to be approximately 385 MtCO
2
in 2017. The gross avoided emissions in non-ETS sectors
were estimated to be approximately 117 MtCO
2
(
26
).
Estimates by the EEA for 2018 show an increase in gross avoided GHG emissions of approximately 8.2 %
from 2017 to 2018. The total avoided GHG emissions in Europe in 2018 are estimated to be 543 MtCO
2
,
roughly 11 % of the total GHG emissions (including international aviation).
(
26
) These estimates are based on the assumption that RES-E generation always replaces a conventional mix of
centralised electricity generation, which takes place within the EU ETS; transport emissions occur outside the
ETS; renewable heat can replace heat that is produced in sectors falling either under the ETS or in non-ETS
sectors. We assume that the share of ETS emissions in the industry sector is an indicator of the share of
renewable heat production in the industry that takes place under the ETS.

Eionet Report - ETC/CME 2019/8 40
Figure 22 Estimated gross reduction in GHG emissions in the EU, by energy market sector
Notes: This figure shows the estimated gross reduction in GHG emissions due to the increase in renewable energy consumption
since 2005.
Source: ETC/CME; (Eurostat 2019a; 2019d)
Eionet Report - ETC/CME 2019/8 41
2005
2010
2015
2016
2017
Proxy 2018
ETS
Electricity
0
-119
-340
-338
-365
-397
Heating and
cooling
0
-14
-17
-19
-20
-21
Transport
0
0
0
0
0
0
All
renewables
0
-133
-357
-357
-385
-418
Non-ETS
Electricity
0
0
0
0
0
0
Heating and
cooling
0
-44
-57
-67
-71
-74
Transport
0
0
-39
-41
-45
-51
All
renewables
0
-44
-96
-107
-117
-126
Total
Electricity
0
-119
-340
-338
-365
-397
Heating and
cooling
0
-58
-74
-85
-91
-95
Transport
0
0
-39
-41
-45
-51
All
renewables
0
-177
-453
-464
-502
-543
Table 6 Estimated gross reduction in GHG emissions in the EU (MtCO2)
Notes: This table shows the estimated gross reduction in GHG emissions due to the increase in renewable energy consumption
(normalised, certified biofuels) since 2005.
Source: ETC/CME; (Eurostat 2019a; 2019d).
3.2.2 Effects at Member State level
In terms of gross avoided GHG emissions in 2017, the countries with the largest estimated gross reductions
were Germany (142 MtCO2), the United Kingdom (50 MtCO2) and Italy (49 MtCO2) (Figure 24). In relative
terms, significant GHG emission reductions (of 10 % or more of the total national GHG emissions, including
international aviation and excluding LULUCF) were recorded in 9 countries in 2017 (Sweden, Denmark,
Finland, Germany, Austria, Lithuania, Spain, Portugal and Italy), as illustrated in Figure 24. It should be
noted again that these figures reflect the development of RES since 2005 — GHG emissions avoided
through RES before this base year are excluded in this methodology.
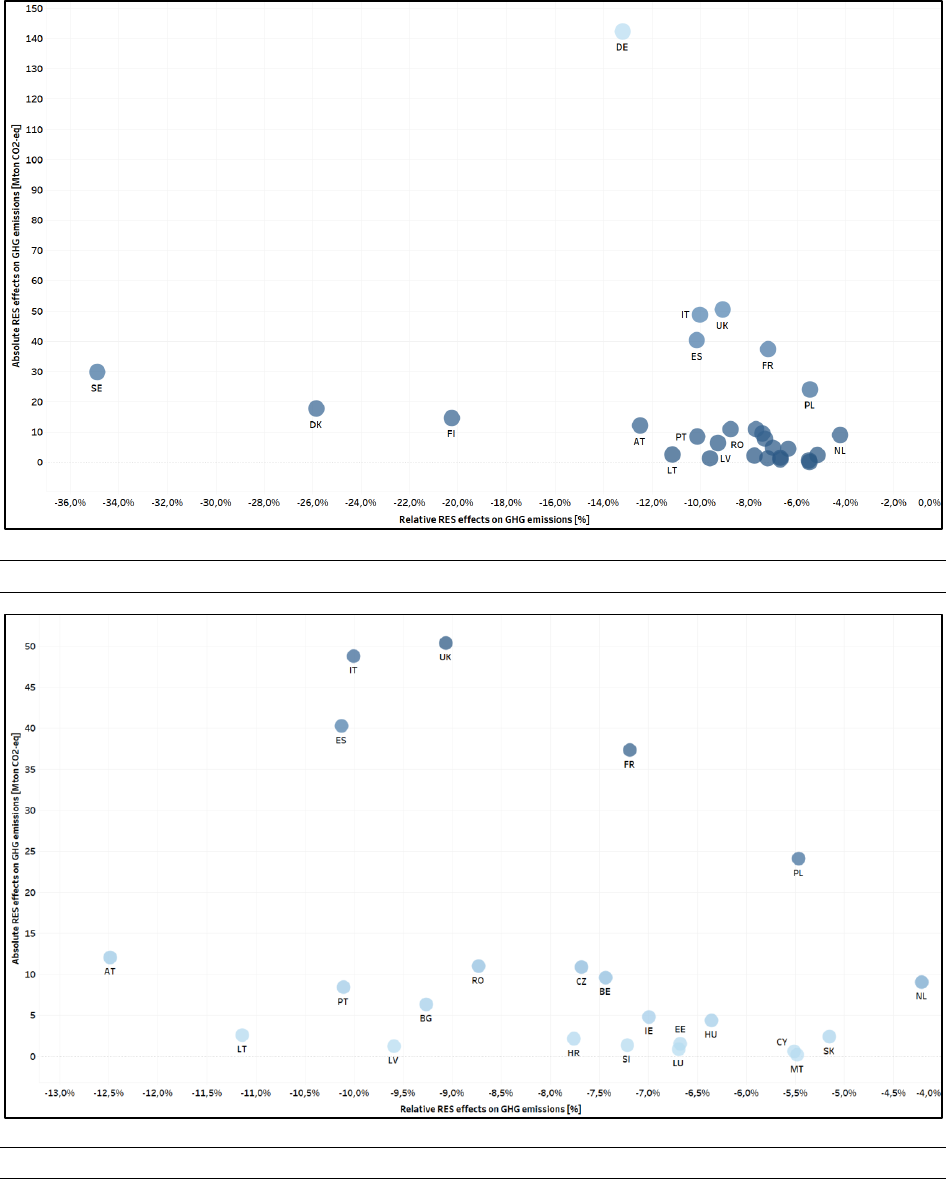
Eionet Report - ETC/CME 2019/8 42
Figure 23 Total and relative gross avoided GHG emissions (per year in 2017)
Figure 24 Total and relative gross avoided GHG emissions (per year in 2017) (zoom-in)
Notes: On both the figures, the vertical axis illustrates the absolute RES effects on GHG emissions in 2017, expressed as million
tonnes (Mt) of gross avoided CO2 emissions per country. The effect is proportional to the increase in national RES consumption
between 2005 and 2017. The further up a country is situated, the higher its gross avoided GHG emissions (Mt CO2). The horizontal
axis illustrates the (relative) impact of national RES growth since 2005 on national GHG emissions. The further to the right a country
is, the more effective national RES consumption was to help reduce total national GHG emission (including international aviation
and excluding LULUCF).
Source: ETC/CME; (Eurostat 2019a; 2019d).

Eionet Report - ETC/CME 2019/8 43
3.3 Statistical impacts of renewable energy sources on primary energy consumption
3.3.1 Effects at EU level
The main energy efficiency policies at the EU level — the recast Energy Performance of Buildings Directive
(EPBD) (EU 2010) and the recast Energy Efficiency Directive (EED) (EU 2012) — set targets and objectives
expressed in primary energy consumption (defined as gross inland energy consumption minus final non-
energy consumption; see Glossary and Abbreviations). As energy efficiency and renewable energy are key
drivers for achieving Europe’s climate and energy targets by 2020 and 2030, synergies between RES
technologies and their statistical impacts on primary energy (
27
) are presented below. The methodology
underpinning these findings was described in a previous EEA report (EEA 2015) (
28
).
At the EU level, primary energy consumption followed an intermittent, yet decreasing, trend until 2014
(EEA 2018b), after which it increased again up to 2017. Next to the key driving factors that affect primary
energy consumption, such as energy efficiency improvements, unusual weather conditions and economic
activity, several other factors are of statistical importance for the overall trend, given their opposing
effects:
• Typically, a decreasing share of nuclear energy and thermal generation (excluding combined heat
and power — CHP) in primary energy consumption is statistically diminishing the latter even if the
final energy consumption is constant. Similarly, a growing share of certain renewable energy
technologies, such as hydro- and wind power, statistically reduces the level of primary energy
consumption, even where final energy use stays unchanged. This is because of the statistical
methodologies in use: to estimate the primary energy of certain technologies or sources, energy
statistics follow the common physical principle of the first measurable primary equivalent energy.
For nuclear and geothermal energy, the first measurable primary equivalent energy is the heat
that is being converted to electricity (at transformation efficiencies typically in the range of 40-
60 %). In contrast, for solar PV and wind energy, the first measurable primary energy equivalent is
the resulting electricity, which thus amounts to a 100 % transformation efficiency for these
technologies, thereby improving the overall conversion efficiency of the energy system and
statistically lowering the level of primary energy consumption.
• General factors driving the accounting of primary energy consumption upwards include an
increasing share of specific renewable energy technologies, such as biomass-based electricity
production. This is because the efficiency of electricity generation from biomass is, on average,
lower than that from fossil fuels. Given these low efficiencies, converting the gross final electricity
obtained from biomass into primary energy will, statistically, worsen the overall conversion
efficiency of the energy system and thus increase total primary energy consumption.
The EEA estimates that deploying renewable energy since 2005 reduced primary energy consumption by
40.7 Mtoe in 2017 — more than the primary energy consumption of Czech Republic in 2017 (see Figure 25
and Table 7). Without the growth in renewable energy since 2005, primary energy consumption in the EU
in 2017 could have been 1.2 % higher, while final energy use in end sectors could have remained
unchanged.
(
27
) Eurostat’s “Primary energy consumption (Europe 2020-2030)”. See 1.2.2.
(
28
) Some changes have been made to the methodology for calculating the effects of renewable energy on primary
energy consumption. It is assumed that the use of renewable biofuels does not have an impact on primary energy
consumption, because the use of fossil fuels (such as petrol and diesel) is replaced by the same amount of
biofuels. Heat extracted from the environment by heat pumps counts as renewable energy. To estimate the
effect of heat pumps on fossil energy consumption and primary energy consumption, we assume a seasonal
performance factor (SPF) for heat pumps of 3.0.
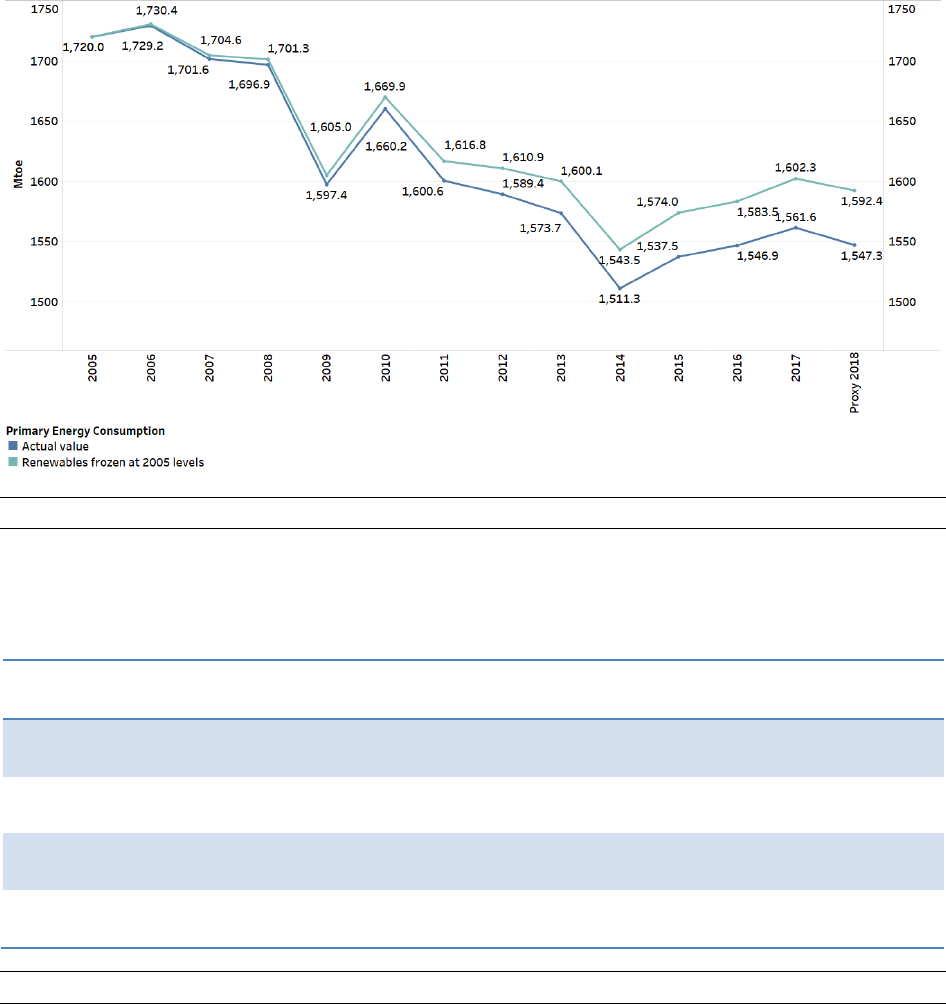
Eionet Report - ETC/CME 2019/8 44
Figure 25 Estimated effect on primary energy consumption in the EU
Notes: This figure shows the estimated effect on primary energy consumption due to the increase in renewable energy
consumption since 2005.
Sources: ETC/CME; (Eurostat 2019a; 2019d).
2005
2010
2015
2016
2017
Proxy 2018
Renewable electricity (normalised, certified biofuels)
0.0
-12.0
-37.7
-37.4
-41.9
-46.5
Renewable heating and cooling (certified biofuels)
0.0
2.3
1.1
0.8
1.1
1.3
Renewable transport (certified biofuels)
0.0
0.0
0.0
0.0
0.0
0.0
All renewables (normalised, certified biofuels)
0.0
-9.7
-36.6
-36.5
-40.7
-45.1
Table 7 Estimated effect on primary energy consumption in the EU (Mtoe)
Notes: This table shows the estimated effect on primary energy consumption due to the increase in renewable energy
consumption since 2005.
Sources: ETC/CME; (Eurostat 2019a; 2019d).
3.3.2 Effects at Member State level
The most important statistical effects of renewable energy on primary energy consumption were recorded
for the United Kingdom, Germany and France, where considerable reductions in primary energy
consumption could be seen (-7 %, -7 % and -5 %, respectively). In Hungary, Latvia, Lithuania, Estonia,
Hungary and Slovakia, the statistical conventions in place resulted in slight increases in primary energy
consumption due to the prevalence of biomass-based renewable energy in these countries. The effects of
renewable energy on GHG emissions and energy consumption in 2017 are summarised by country in Annex
1.

Eionet Report - ETC/CME 2019/8 45
3.4 Gross effect on air pollutant emissions
3.4.1 Effects at EU level
At the EU level, for 2017, the total estimated RES effect results in a decrease of air pollutant emissions of
46 kt for NOx and 159 kt for SO
2
, compared with a counterfactual scenario in which RES consumption
would have remained at the levels of 2005. However, for PM10, PM2.5 and VOC emissions, the result is
an increase of respective 149, 145 and 296 kt in 2017 compared with 2005 (see tables below). On the
relative level, comparing to total emissions frozen at 2005 level, the additional consumption of renewable
energy sources across the EU since 2005 has led to a decrease of SO
2
and NO
x
emissions in 2017, by 6 %
and 1 %, respectively. In contrast, an indicative increase of EU-wide emissions for PM and VOCs took place
in 2017, following the increase in biomass use since 2005 (by 13 % for PM
2.5
, 8 % for PM
10
and 4 % for
VOCs) (see second table of Annex 2).
In more detail, due to the increase in the gross final consumption of RES since 2005, all emissions from the
RES-E market sector decreased, except for VOC emissions. The picture is different for the RES-H/C market
sector, for which all the emissions increased, except for SO2 emissions.
Example: For heat non-ETS (essentially corresponding to the residential and services sectors), if it is assumed that 100
PJ of renewable solid fuels have replaced an equivalent amount of energy otherwise supplied with by average fossil
fuel mix, this results in higher implied emission factors for all pollutants, except for SO
2
. This is because, in most cases,
less emitting fuels such as natural gas were part of the average fossil fuel mix.
The larger the initial share of natural gas in the average fossil fuel mix, the higher the relative increase of the implied
emission factors associated with the renewable solid fuels.
The assumption of using a weighted average emission factor for fossil fuels assumed to have been replaced
by renewable energy means that, in the case of combustion-based renewables, emissions can increase for
some pollutants. This is because some renewable fuels have higher emission factors than the weighted
average fossil fuel emission factor of the fossil fuel they are assumed to substitute.
Table 8 Estimated effect on NO
x
emissions in the EU (kt)
2005
2006
2007
2008
2009
2010
2011
2012
2013
2014
2015
2016
2017
RES-E
0.0
-6.1
-11.9
-18.1
-24.2
-29.4
-35.5
-44.0
-50.1
-56.9
-66.3
-69.9
-76.5
RES-H/C
0.0
6.4
13.1
19.6
17.9
27.8
17.8
29.5
32.9
22.8
27.5
28.0
30.8
All RES
0.0
0.3
1.2
1.5
-6.3
-1.6
-17.6
-14.5
-17.2
-34.1
-38.9
-41.9
-45.8
National Total
(EEA, 22 July 2019)
12146
11805
11419
10567
9680
9515
9144
8808
8431
8122
7956
7672
7532
Sources: ETC/CME, IIASA 2017, Eurostat 2019a; 2019c.
Table 9 Estimated effect on PM
10
emissions in the EU (kt)
2005
2006
2007
2008
2009
2010
2011
2012
2013
2014
2015
2016
2017
RES-E
0.0
-0.4
-0.7
-0.9
-1.0
-1.0
-1.3
-1.6
-1.6
-1.5
-1.3
-1.1
-0.8
RES-H/C
0.0
8.7
47.8
84.8
102.5
135.0
83.5
134.0
145.7
104.9
128.3
139.4
149.3
All RES
0.0
8.3
47.1
83.9
101.5
134.0
82.2
132.4
144.1
103.4
126.9
138.3
148.5
National Total
(EEA, 22 July 2019)
2579
2535
2488
2451
2328
2348
2209
2180
2147
2031
2034
2012
2019
Sources: ETC/CME, IIASA 2017, Eurostat 2019a; 2019c.

Eionet Report - ETC/CME 2019/8 46
Table 10 Estimated effect on PM
2.5
emissions in the EU (kt)
2005
2006
2007
2008
2009
2010
2011
2012
2013
2014
2015
2016
2017
RES-E
0.0
-0.2
-0.4
-0.5
-0.5
-0.5
-0.7
-0.9
-0.8
-0.8
-0.6
-0.5
-0.3
RES-H/C
0.0
8.6
46.5
82.5
99.8
131.5
81.6
130.7
142.0
102.4
125.0
135.9
145.7
All RES
0.0
8.5
46.2
82.0
99.3
131.1
80.9
129.9
141.2
101.6
124.4
135.5
145.4
National Total
(EEA, 22 July 2019)
1667
1619
1598
1584
1520
1551
1435
1443
1416
1309
1313
1301
1304
Sources: ETC/CME, IIASA 2017, Eurostat 2019a; 2019c.
Table 11 Estimated effect on SO
2
emissions in the EU (kt)
2005
2006
2007
2008
2009
2010
2011
2012
2013
2014
2015
2016
2017
RES-E
0.0
-18.4
-32.6
-43.7
-47.9
-47.8
-60.5
-74.4
-81.9
-87.8
-90.1
-89.0
-89.8
RES-H/C
0.0
-4.7
-6.6
-14.6
-20.7
-40.2
-40.4
-50.6
-55.0
-47.0
-55.7
-66.5
-68.9
All RES
0.0
-23.1
-39.1
-58.3
-68.6
-88.0
-100.9
-125.0
-136.9
-134.8
-145.7
-155.5
-158.7
National Total
(EEA, 22 July 2019)
7707
7455
7064
5428
4531
4207
4111
3698
3223
2958
2792
2352
2323
Sources: ETC/CME, IIASA 2017, Eurostat 2019a; 2019c.
Table 12 Estimated effect on VOC emissions in the EU (kt)
2005
2006
2007
2008
2009
2010
2011
2012
2013
2014
2015
2016
2017
RES-E
0.0
0.5
1.4
2.0
2.6
4.1
6.1
8.2
12.2
13.6
14.0
14.3
14.3
RES-H/C
0.0
15.6
79.6
142.6
173.2
244.2
164.6
255.6
283.3
203.8
245.6
267.3
281.3
All RES
0.0
16.1
81.1
144.6
175.8
248.3
170.7
263.8
295.5
217.4
259.6
281.6
295.6
National Total
(EEA, 22 July 2019)
9560
9341
9009
8609
8009
7993
7553
7403
7162
6939
6905
6876
6964
Sources: ETC/CME, IIASA 2017, Eurostat 2019a; 2019c.
3.4.2 Effects at Member State level
At the Member State level, absolute and relative impacts on key air pollutant emissions NO
x
, SO
2
, PM
2.5
,
PM
10
and VOC in 2017 due to the increase of RES consumption since 2005 are illustrated in figures (Figure
26 to Figure 30 and in the tables in Annex 2). It can be observed that for countries that consume renewable
fuels (solid, liquid, gaseous) some of the air pollutant emissions increase due to the different composition
of the fuels and/or technologies (including abatement) used.
The results are best suited for analysis and conclusions on the aggregated EU level, where certainty is
highest. Nevertheless, at the country level the results provide a useful general indication of the influence
the increase in renewable energy consumption since 2005 had on air pollutant emissions. This follows
from the likely interactions between the mix of renewable energy sources that supplied the energy, on the
one hand, and the fossil fuel sources they substituted, on the other hand.
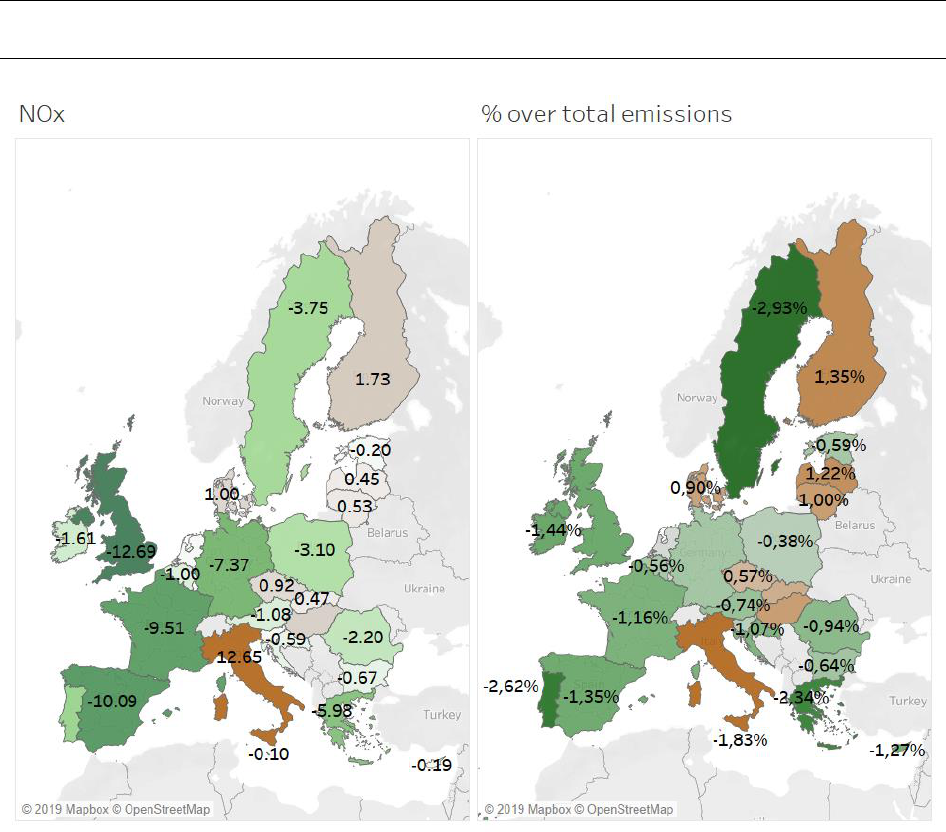
Eionet Report - ETC/CME 2019/8 47
Figure 26 Estimated effects of RES consumption increase since 2005 on total NOx pollutant emissions
in absolute values (kt, in 2017) and relative change over national total emissions (%, in 2017)
Sources: ETC/CME, IIASA 2017, Eurostat 2019a; 2019c.

Eionet Report - ETC/CME 2019/8 48
Figure 27 Estimated effects of RES consumption increase since 2005 on total SO2 pollutant emissions in
absolute values (kt, in 2017) and relative change over national total emissions (%, in 2017)
Sources: ETC/CME, IIASA 2017, Eurostat 2019a; 2019c.
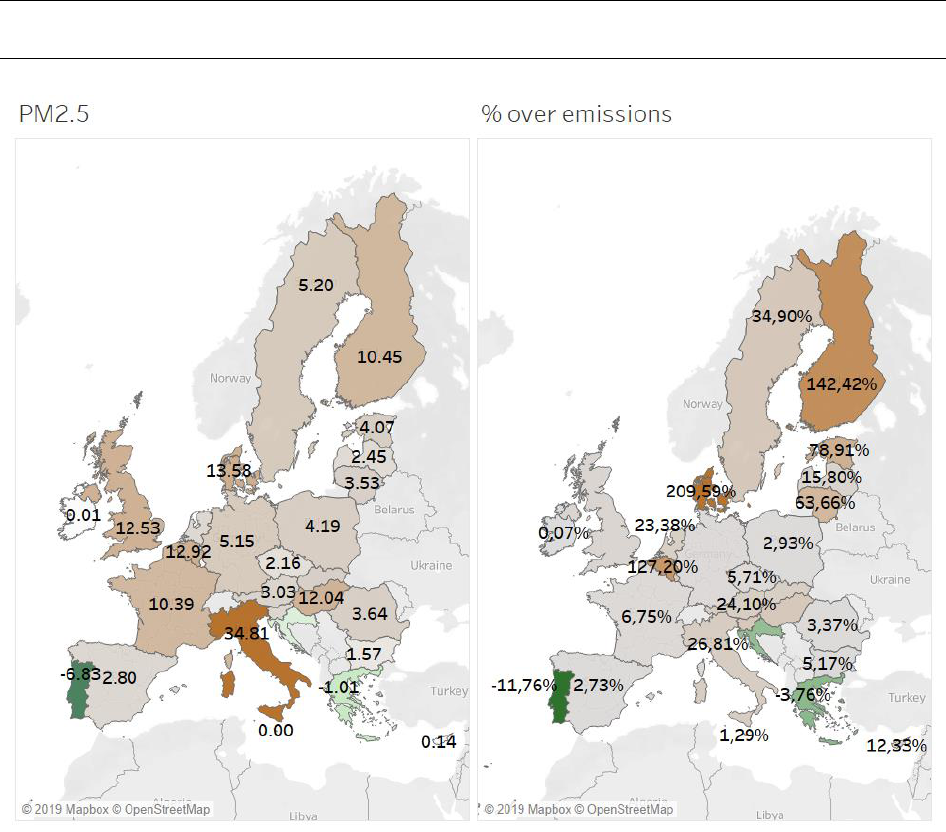
Eionet Report - ETC/CME 2019/8 49
Figure 28 Estimated effects of RES consumption increase since 2005 on total PM2.5 pollutant emissions
in absolute values (kt, in 2017) and relative change over national total emissions (%, in 2017)
Sources: ETC/CME, IIASA 2017, Eurostat 2019a; 2019c.
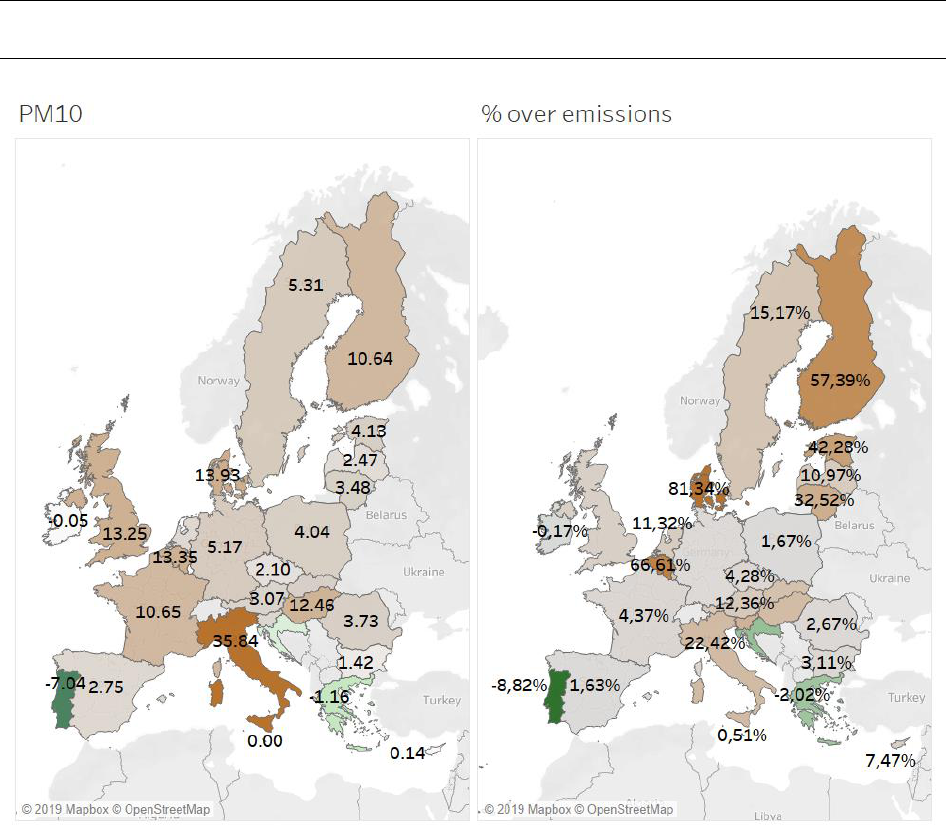
Eionet Report - ETC/CME 2019/8 50
Figure 29 Estimated effects of RES consumption increase since 2005 on total PM10 pollutant emissions
in absolute values (kt, in 2017) and relative change over national total emissions (%, in 2017)
Sources: ETC/CME, IIASA 2017, Eurostat 2019a; 2019c.
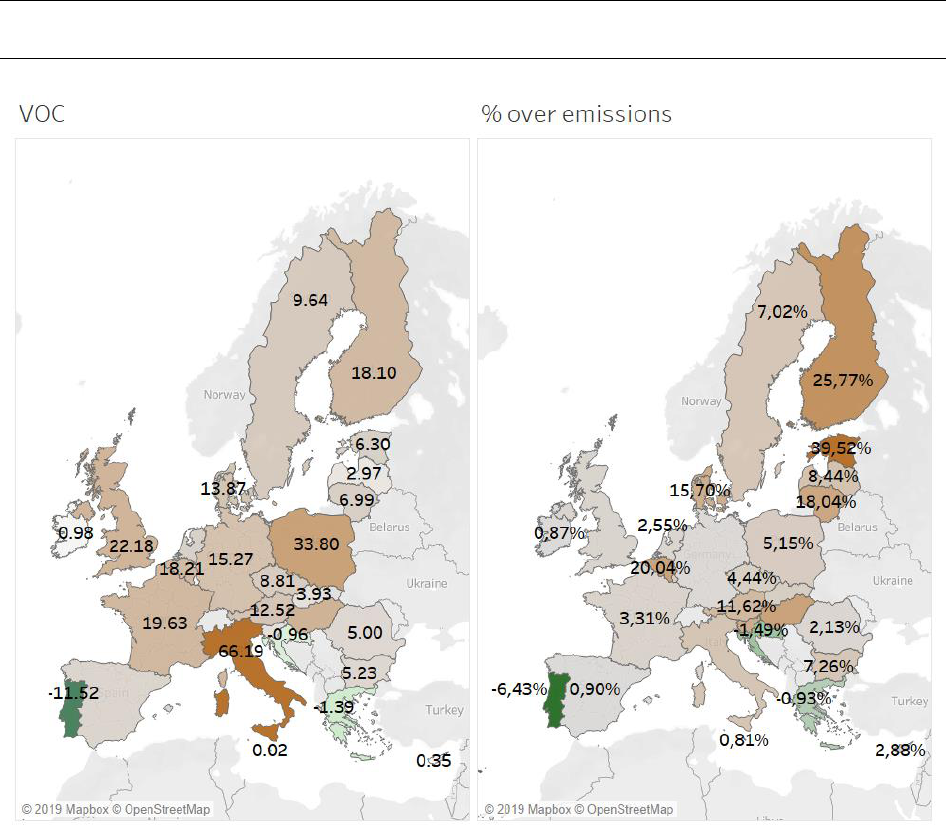
Eionet Report - ETC/CME 2019/8 51
Figure 30 Estimated effects of RES consumption increase since 2005 on total VOC pollutant emissions in
absolute values (kt, in 2017) and relative change over national total emissions (%, in 2017)
Sources: ETC/CME, IIASA 2017, Eurostat 2019a; 2019c.
Note that in the above figures (Figure 26 to Figure 30) the map at the right shows the relative change of
emissions compared to 2005 due to RES deployment over the national total in 2017 while the second table
of Annex 2 shows the relative effect of deploying renewable energy since 2005 on national total air
pollutant emissions frozen at 2005 level in 2017.
In relative terms, for NO
x
the results vary from a strong decrease to an increase in emissions (see Figure
26). The strongest decreases are caused by increasing shares of wind energy (both onshore and offshore)
and, to a lesser extent, solar photovoltaic (Germany, Italy, the United Kingdom), which are not offset by
an increase of emissions from biogas use in renewable electricity and biomass in renewable heat
production.
For SO
2
, all countries show a decreasing trend in emissions (Figure 27), because almost all of the fossil fuels
have higher implied emission factors than the renewable fuels, except for heat production by installations
subject to the ETS.
For PM
2.5
, PM
10
and VOCs, except for Portugal, which has decreased its consumption of biomass
considerably since 2005, all countries show a relative increase of emissions due to RES consumption,
against the backdrop of biomass consumption increases in almost all countries over the period. The
increase of RES-related particulate emissions is likely to have led to a strong increase of PM concentrations.

Eionet Report - ETC/CME 2019/8 52
3.5 Indirect effects by renewable energy technology
Table 13 shows the estimated impact of each renewable energy technology on GHG emissions, fossil fuel
consumption and primary energy consumption (
29
).
In 2017, the largest amounts of gross avoided GHG emissions were attributable to onshore wind energy
(158 MtCO
2
), solar PV energy (77 MtCO
2
) and heat from solid biomass (71 MtCO
2
) (
30
). Onshore wind and
solar PV energy are also the most significant contributors to avoided primary energy consumption (27 and
13 Mtoe, respectively). For the avoided fossil fuel consumption, the first two most significant contributors
are onshore wind (46 Mtoe) and heat from solid biomass (25 Mtoe).
The use of solid biomass for electricity and heating leads to a reduction in GHG emissions and fossil fuel
consumption, but it drives up primary energy consumption.
Owing to the statistical conventions in place, consumption of concentrated solar power and geothermal
energy can also increase primary energy consumption. These statistical interactions suggest that primary
energy consumption trends alone do not present the full picture of the deeper energy consumption trends
in end-use sectors.
For 2018, preliminary estimates by the EEA show that the amount of avoided GHG emissions will further
increase to 543 MtCO
2
. This is mainly driven by additional renewable energy consumption originating from
onshore wind technologies, with estimated avoided GHG emissions of 173 MtCO
2
(an additional 15 MtCO
2
compared with 2017), followed by solid biomass, offshore wind and solar PV energy.
(
29
) Eurostat’s “Primary energy consumption (Europe 2020-2030)”. See 1.2.2.
(
30
) The impact of biomass consumption on actual GHG emissions is uncertain in the absence of accounting for
LULUCF.

Eionet Report - ETC/CME 2019/8 53
Source of renewable
energy
Increase in renewable
energy consumption
since 2005 (ktoe)
Gross avoided GHG
emissions
(MtCO
2
)
Avoided fossil fuel
consumption
(ktoe)
Effect on primary
energy consumption
(ktoe)
2017
Proxy
2018
2017
Proxy
2018
2017
Proxy
2018
2017
Proxy
2018
Renewable electricity
Biogas
4 410
4 494
-39
-40
-10 430
-10 638
71
61
Bioliquids (certified)
415
415
-3
-3
-913
-912
27
27
Concentrated solar
power
506
530
-4
-4
-1 260
-1 319
258
270
Geothermal
119
122
-1
-1
-262
-270
927
953
Hydropower excl.
pumping (normalised)
414
660
-3
-5
-759
-1 383
-345
-723
Offshore wind
(normalised)
5 168
6 088
-39
-45
-11 743
-13 753
-6 575
-7 665
Onshore wind
(normalised)
18 707
20 350
-158
-173
-45 760
-49 739
-27 053
-29 389
Solar PV energy
9 635
10 343
-77
-84
-22 356
-24 033
-12 721
-13 693
Solid biomass
5 298
5 468
-41
-42
-12 523
-12 875
3 532
-3 694
Tidal, wave and ocean
energy
4
6
0
0
-8
-14
-4
-7
Renewable heat
Biogas
3 173
3 341
-10
-10
-3 543
-3 731
-17
-18
Bioliquids (certified)
237
241
-1
-1
-265
-269
2
2
Geothermal
269
310
-1
-1
-300
-346
237
274
Renewable energy from
heat pumps
8 182
8 329
-5
-5
-3 790
-3 819
-3 790
-3 819
Solar thermal
1 610
1 714
-5
-5
-1 799
-1 915
-189
-201
Solid biomass
22 731
23 672
-71
-73
-25 412
-26 464
4 895
-5 098
Biofuels in transport
Biodiesels (certified)
11 894
13 446
-37
-42
-11 894
-13 446
0
0
Biogasoline (certified)
2 755
3 080
-8
-9
-2 755
-3 080
0
0
Other biofuels (certified)
150
184
0
-1
-150
-184
0
0
Total renewables
(normalised, certified
biofuels)
95 676
102 794
-502
-543
-155 922
-168 194
-40 748
-45 137
Table 13 Effect of renewable energy on GHG emissions and energy consumption by technology in the
EU
Notes: This table shows the estimated effect on GHG emissions, fossil fuel consumption and primary energy consumption due to
the increase in renewable energy consumption since 2005.
Source: ETC/CME. (Eurostat 2019a; 2019d)

Eionet Report - ETC/CME 2019/8 54
Table 14 provides an overview of the estimated RES effects on air pollutant emissions per air pollutant,
compared with the estimated RES effect on fossil fuel consumption, per renewable energy technology.
The table illustrates that those technologies that do not combust renewable fuels (like wind power, solar
PV, geothermal, heat pumps, solar thermal, etc.) have the largest reducing impact on air pollutant
emissions.
For combustion-based renewable energy technologies (using solid, liquid and gaseous renewable fuels),
an increase for some of the air pollutant emissions can be observed. This increase is due to the different
composition of the renewable fuels and/or of the technology used, including the level of abatement
installed compared with the fossil fuel/technology assumed to be substituted. These impacts are already
reflected in the implied emissions factors that are used in the calculation of the effect.
Besides the fact that some combustible renewable fuels tend to have high emission factors for some key
pollutants, also the characteristics of the fossil fuels assumed to be replaced (solid, liquid, gaseous) has an
impact on the weighed implied emission factor for fossil fuels and, hence, on the resulting avoided
emissions.
Example: As illustrated in Table 14, in the RES-E and RES-H/C market sectors, combustible biomass-based technologies
replace a relatively high share of fossil gaseous fuels, with relatively low emissions. This explains why the net effect
on emissions is relatively large in such cases.

Eionet Report - ETC/CME 2019/8 55
Table 14 Estimated effects of RES consumption increase since 2005 on key air pollutant emissions (kt, per year, in 2017) and on fossil fuel consumption (ktoe,
per year, in 2017) in the EU
2017
(2005-RES shares counterfactual)
Effect on NOx
emissions
(kt)
Effect on
PM_10
emissions
(kt)
Effect on
PM_2_5
emissions
(kt)
Effect on SO2
emissions
(kt)
Effect on VOC
emissions
(kt)
Effect on
fossil fuel
consumption;
Gaseous fuels
(ktoe)
Effect on
fossil fuel
consumption;
Petroleum
products
(ktoe)
Effect on
fossil fuel
consumption;
Solid Fuels
(ktoe)
Effect on
fossil fuel
consumption;
Total
(ktoe)
(1)
Renewable Electricity: Biogas
18.7
-0.1
-0.0
-4.1
19.0
-2 221
-329
-7 637
-10 430
Renewable Electricity: Bioliquids [compliant]
0.6
-0.0
-0.0
-0.1
0.0
-435
-23
-431
-913
Renewable Electricity: Concentrated solar power
-1.3
-0.0
-0.0
-1.3
-0.1
-407
-170
-670
-1 260
Renewable Electricity: Geothermal
-0.3
-0.0
-0.0
-0.1
-0.0
-118
-9
-128
-262
Renewable Electricity: Hydropower excl. pumping
[normalized]
-1.5
-0.2
-0.2
-2.2
-0.1
-611
819
-917
-759
Renewable Electricity: Offshore wind [normalized]
-16.0
-0.4
-0.3
-10.5
-0.7
-4 590
-1 367
-5 500
-11 743
Renewable Electricity: Onshore wind [normalized]
-51.7
-2.1
-1.7
-43.3
-3.3
-12 356
-8 856
-23 573
-45 760
Renewable Electricity: Solar photovoltaic
-26.7
-1.1
-0.8
-19.5
-2.2
-7 409
-1 258
-13 105
-22 356
Renewable Electricity: Solid biomass
1.7
3.0
2.8
-8.6
1.7
-4 688
-2 787
-4 729
-12 523
Renewable Electricity: Tidal, wave and ocean energy
-0.0
-0.0
-0.0
-0.0
-0.0
-4
-1
-3
-8
Total Renewable Electricity
-76.5
-0.8
-0.3
-89.8
14.3
-32 838
-13 983
-56 693
-106 013
Renewable Heat: Biogas
5.5
-2.0
-1.9
7.8
-1.0
-2 415
-905
-223
-3 543
Renewable Heat: Bioliquids [compliant]
0.3
-0.0
-0.0
-0.0
-0.0
-191
-63
-11
-265
Renewable Heat: Geothermal
-0.6
-0.2
-0.2
-0.6
-0.1
-199
-84
-17
-300
Renewable Heat: Renewable energy from heat
pumps
-13.4
-4.6
-4.2
-14.3
-2.5
-5 320
-2 087
3 339
-3 790
Renewable Heat: Solar thermal
-3.2
-1.3
-1.2
-3.9
-0.7
-1 080
-617
-102
-1 799
Renewable Heat: Solid biomass
42.3
157.5
153.2
-57.9
285.5
-15 967
-7 150
-2 296
-25 412
Total Renewable Heat
30.8
149.3
145.7
-68.9
281.3
-25 171
-10 907
690
-35 110
Note (1): The effect on the total fossil fuel consumption is the sum of the effects on gaseous fuels, petroleum products, solid fuels and petrol, diesel and non-renewable waste. Solely the large fuel
categories (gaseous fuels, petroleum products and solid fuels) are included in this table and that is why the total effect on fossil fuel consumption can be higher than the sum of the three individual
effects in the previous three columns.
Sources: ETC/CME, IIASA 2017, Eurostat 2019a; 2019c.

Eionet Report - ETC/CME 2019/8 56
4 EU developments in renewable energy sources in a global perspective
On a global scale, traditional biomass is still an important source of energy for a majority of the world’s
population, despite the associated health and environmental impacts (
31
). The available global data on
gross renewable energy consumption do not make it possible for traditional biomass fuels to be excluded
from the set of modern RES. The aggregate numbers therefore obscure underlying trends in modern RES,
which offer the most relevant points of comparison for European developments. Therefore, this chapter
focuses on global developments in RES-E only, such as installed RES-E capacities and investments, as a way
(
31
) Traditional biomass energy refers to the burning of fuel wood, charcoal, agricultural and forest residues, or dung
on open fires for cooking and heating. It is associated with considerable health and environmental impacts and
it is still dominant in Africa (especially in sub-Saharan Africa) and in developing Asia (e.g. Bangladesh, Cambodia,
Myanmar/Burma and Sri Lanka). It is estimated that roughly 68 % of all heat generated from biomass globally
comes from traditional biomass (REN 21 2017).
Key messages
• Globally, RES-E capacity continued to increase, reaching 2 350 GW in 2018, up by 171 GW over the
previous year.
• After nearly two decades of strong annual growth, renewables around the world added as much net
capacity in 2018 as they did in 2017, an unexpected flattening of growth trends that raises concerns about
meeting long-term climate goals.
• Global investment in renewables in 2018 stood at 244.3 billion euro, about 15 % less than the investment
in 2017.
• Renewables delivered more than one quarter (26.2 %) of the total global electricity generation in 2018.
• Historically, the EU dominated new investments in renewable energy, as a proportion of global
investment, between 2005 and 2012. However, China surpassed the EU in 2013 and has maintained its
leading position since then, although a drastic fall in share from 45 % in 2017 to 32 % in 2018.
• In terms of installed RES-E capacity, the EU (465 GW) maintains the second position after China (696 GW)
in 2018. Since 2017, China has displaced the EU as market leader in solar PV capacity. In 2018, with a total
of 185 GW of installed wind capacity, China also displaced the EU to become global leader in installed wind
capacity.
• Since 2015, the developing world invested more in green energy than developed economies. Developing
economies (including China, Brazil and India) committed 124.7 billion euro to renewables in 2018
compared with the 106.6 billion euro committed by developed countries.
• On a per capita basis, the EU remains the clear world leader in renewable power, with 0.91 kW RES-E
capacity installed per person in 2018. Per unit of GDP in 2018, the EU did reasonably well in deploying
renewables compared with other world regions, e.g., the United States, ASOC (Asia and Oceania, excluding
India and China) and India.
• Total global employment in the renewable energy industry in 2018 was 11 million, a 6.8 % increase over
the previous year.
• Of world regions with sufficient available data, the EU came second after China in 2018 in terms of
employment in the renewable energy industry. However, in terms of share of renewable energy jobs in
the total labour force, the EU (0.50 % of the total labour force employed in the renewable energy industry),
is almost on par with China (0.52 %). In the EU, Germany, with 0.67 % of its labour force working in jobs
related to renewable energy, plays a leading role.

Eionet Report - ETC/CME 2019/8 57
of contrasting European developments in this market sector with the changes occurring in other parts of
the world.
The 2030 Agenda for Sustainable Development, adopted by all United Nations Member States in 2015,
includes the 17 Sustainable Development Goals (SDGs), which are an urgent call for action by all countries
- developed and developing - in a global partnership (UN 2019a). SDG7 calls for “affordable, reliable,
sustainable and modern energy for all” by 2030. Yet, 840 million people in the world today have no access
to electricity, and roughly 3 times that number use dirty cooking fuels (UN 2019b). The role of renewable
energy in achieving SDG7 is well recognised. One of the three core foundation goals of the Sustainable
Energy for All, or in short SEforALL, an international initiative supporting SDG7, has been on renewable
energy, “to accelerate our transition to a sustainable energy future and meet SDG7 targets, we must
double the global share of renewable energy by 2030”. With rapidly falling solar PV installation costs,
populations without access to the central electricity grid can benefit from off-grid solar and other
decentralized solutions, which can provide energy access at lower costs. Developing countries with severe
energy access gaps have started to embrace integrated approaches to electricity supply, combining
improved centralized electricity grids with distributed renewable energy solutions. A study carried out by
the Smart Power India, a program of the Rockefeller Foundation, reported 106 mini grids that use
renewable energy based generators operating in rural areas across India to provide electricity access to
people (SmartPowerIndia 2017). According to the World Energy Outlook 2019 (IEA 2019b), the share of
renewables (modern bio-energy + electricity
32
) in global total final energy consumption was 10 % in 2018.
While electricity generation from renewables is increasing at rapid pace, its use in heat and transportation
sectors is also expanding.
4.1 Renewable electricity capacities by region and main source
4.1.1 Renewable electricity development by region
After nearly two decades of strong annual growth, renewables around the world added as much net
capacity in 2018 as they did in 2017, an unexpected flattening of growth trends that raises concerns about
meeting the long-term climate goals (IEA 2019a). An estimated 171 GW was installed worldwide for
renewable energy in power generation, almost the same as the 2017 additions.
This is the first time since 2001 that growth in renewable power capacity failed to increase noticeably on
a year on year basis. Overall, renewable energy has grown to account for more than 33 % of the world’s
total installed power generating capacity (REN21 2019). The overall global renewable power capacity
totalled to 2 351 GW by the end of 2018 (IRENA 2019a), about 8 % higher than the year 2017 and was
enough to supply around 26.2 % of global electricity production. Hydropower still accounted for some
60 % of renewable electricity production in 2018, followed by wind power (21 %), solar PV (9 %) and bio-
power (8 %) (REN21 2019). Globally, renewable capacity more than doubled over the decade from 2008
to 2018. The ongoing growth in capacity and the geographical expansion in renewable power technologies
are driven by a number of factors, including rising electricity demand in some countries, targeted
renewable energy support mechanisms and continuing decreasing costs (particularly for solar PV and wind
power).
By 2018, renewable energy targets had been adopted in 169 countries at the national or state/provincial
level, which is a decline, compared to 2017 when 179 countries had renewable energy targets in place.
This decline is due to several targets having expired and not having been replaced. New and revised targets
have become increasingly ambitious, particularly in the power sector. Countries with 100 % renewable
electricity targets have increased from 57 in 2017 to 65 in 2018 (REN21 2019). The use of auctions to
procure renewable power projects is spreading to an increasing number of countries, but FIT (Feed-in-
Tariff) policies and other incentives are still important for advancing renewable power.
32
Solid biomass excluded
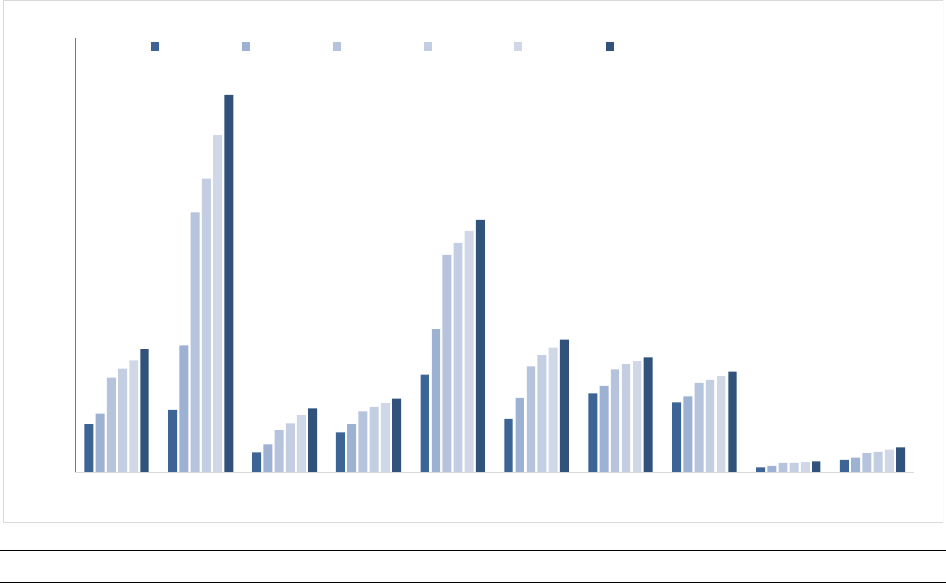
Eionet Report - ETC/CME 2019/8 58
Since 2015, additions of renewable power generation capacity outpaced net installations of fossil fuel and
nuclear power capacity combined (REN21 2019). For fossil fuel technologies, in 2018, a net generation
capacity of 20 GW of coal-fired and 42 GW of gas-fired plants was added to the global fleet (Frankfurt
School-UNEP 2019). The net addition to nuclear capacity was -5 GW on a global scale. Taken together, a
net capacity of 67 GW of fossil fuel and nuclear power plant capacity was added in 2018. Overall,
renewables thus accounted for approximately 74 % of net additions to global power capacity in 2018,
largely due to continued improvements in the cost-competitiveness of solar PV and wind power (Frankfurt
School-UNEP 2019).
World regions can be clustered into three groups of countries based on their RES-E capacity developments
between 2005 and 2018 (expressed in total capacity, per capita capacity and capacity per unit GDP, as
illustrated in Figure 31, Figure 32 and Figure 33.
• In the first group — China, India, Brazil, ASOC (Asia, excluding China and India, and Oceania) —
electricity consumption is expanding rapidly, and both renewable energy and fossil fuel generation
are being deployed to meet growing demand.
• The second group — EU-28 and the United States — is experiencing slow or negative growth in
electricity consumption. In these countries/regions, renewable energy is increasingly displacing
existing generation and disrupting traditional energy markets and business models.
• For the third group of countries — Africa, the Americas (excluding the United States and Brazil),
the Middle East and OE-CIS (Other Europe and Commonwealth of Independent States) — RES-E
development has been relatively slow, despite growing electricity consumption.
Figure 31 RES-E capacities in selected world regions, 2005-2018
Notes: ASOC refers to Asia (excluding China and India) and Oceania; OE-CIS refers to Other Europe and the Commonwealth of
Independent States; full information about the geographical coverage and regional aggregations is provided in the glossary.
Source: (IRENA 2019a)
The prime example of the first group of countries is China. With 696 GW of RES-E capacity installed and
grid connected, China managed to increase its RES-E capacity by a factor of six over the period 2005-2018,
0
100
200
300
400
500
600
700
800
ASOC China India Brazil EU-28 USA Americas Other Europe
& CIS
Middle East Africa
RES-E capacity in GWe
2005 2010 2015 2016 2017 2018
World total capacity 2018: 2350 GWe
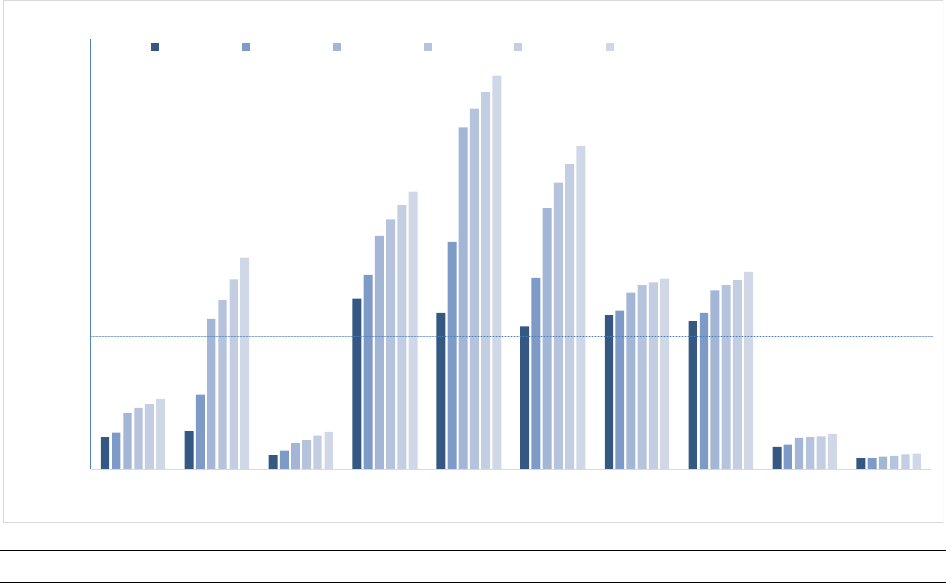
Eionet Report - ETC/CME 2019/8 59
maintaining a strong compound annual growth rate of 15.0 %. China alone was home to nearly 30 % of the
world’s renewable power capacity in 2018. With 323 GW installed (not including pumped storage),
hydropower is by far its largest RES-E source, with wind power (184 GW) coming in a distant second. At
175 GW, solar power is catching up rapidly. Of the other countries in this group, India tripled its RES-E
capacity over the period 2005-2018 (from 36 to 118 GW) and has established itself as one of the top
countries in terms of wind, solar PV and hydropower added capacity (IRENA 2018a; REN21 2018). Starting
from a strong base in installed hydropower (71 GW or 95 % of the total RES-E capacity of 74 GW in 2005),
Brazil has also experienced strong growth and diversification of its RES-E asset base. In 2018, hydropower
(104 GW) accounted for 76 % of the total installed capacity of 136 GW.
Figure 32 RES-E capacities per capita in selected world regions, 2005-2018
Notes: ASOC refers to Asia (excluding China and India) and Oceania; OE-CIS refers to Other Europe and the Commonwealth of
Independent States; full information about the geographical coverage and regional aggregations is provided in the glossary.
Population data are obtained from the UN/DESA/Population Division website (UN 2019).
Sources: (UN 2019); (IRENA 2019a).
0
0,1
0,2
0,3
0,4
0,5
0,6
0,7
0,8
0,9
1
ASOC China India Brazil EU-28 USA Americas Other Europe
& CIS
Middle East Africa
RES-E capacity in kWe per person
2005 2010 2015 2016 2017 2018
World Average 2018: 0.31 kWe/person
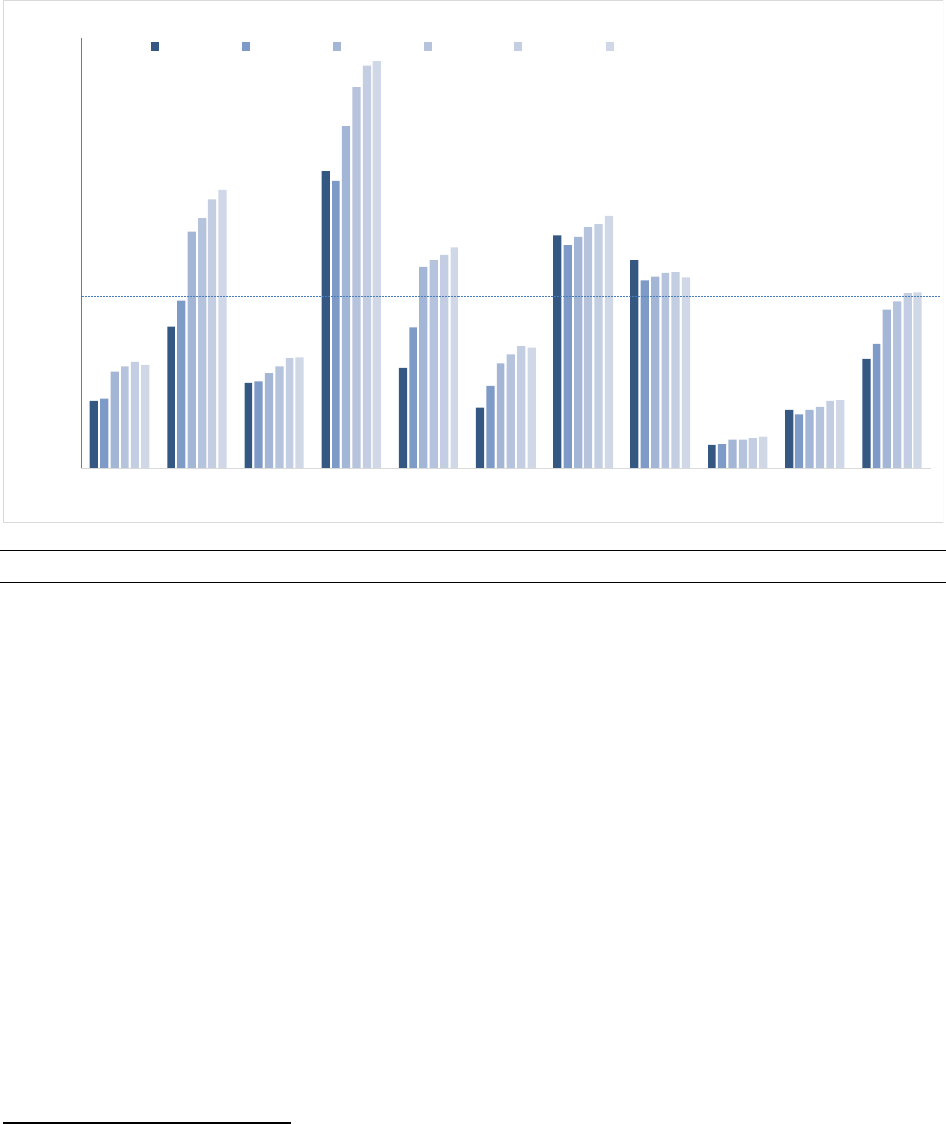
Eionet Report - ETC/CME 2019/8 60
Figure 33 RES-E capacities per GDP in selected world regions, 2005-2018
Notes: ASOC refers to Asia (excluding China and India) and Oceania; OE-CIS refers to Other Europe and the Commonwealth of
Independent States; full information about the geographical coverage and regional aggregations is provided in the glossary. GDP
is expressed as constant 2011 euro value (EUR
2011
) at purchasing power parity (PPP) (
33
).
Sources: (World Bank 2019b); (IMF 2019); (IRENA 2019a); (OECD 2019).
In terms of RES-E, development per capita or per GDP, the picture looks slightly different for the
countries/regions in the first group:
• With 56.8 kW/million constant EUR
2011
(at PPP) installed in 2018, Brazil remains the best
performing country, although growth in this indicator over the period 2005-2018 was relatively
modest (37 % in total, or 2.4 % per year on average) compared with other countries/regions. In
per capita terms, RES-E has grown steadily over time, from 0.39 kW/person in 2005 to
0.64 kW/person in 2018.
• Rapid growth in renewable capacity, coupled with population control policies, has led China to
increase its RES-E capacity per capita by a factor of more than five (from a mere 0.09 kW in 2005
to 0.49 kW in 2018). This helped the country score well above the world average but still far
behind world leaders such as the EU (0.91 kW/person in 2018), the United States
(0.75 kW/person in 2018) or even Brazil (0.64 kW/person in 2018). RES-E development in China
has even outpaced its strong economic growth over the period 2005-2018. With 38.8 kW/million
(
33
) Processing GDP data for the period 2005-2018: GDP data expressed as constant 2011 international dollars at PPP
for all countries for the period 2005-2017 are obtained from the World Bank database (World Bank 2019b). For
the year 2018, GDP data for all countries expressed as current prices in international dollars at PPP are obtained
from the World Economy Outlook database of the International Monetary Fund (IMF, 2019). For each country,
a conversion factor is calculated dividing GDP data for 2017 expressed as constant 2011 international dollars at
PPP by GDP data for 2017 expressed as current international dollars at PPP, and then it is multiplied by the 2018
GDP data of that country expressed as current prices in international dollars at PPP to transform it into GDP
expressed as constant 2011 international dollars at PPP. The PPP conversion rate for the year 2011 between
euros and dollars is obtained from the Organisation for Economic Co-operation and Development’s database
(OECD 2019).
0,0
10,0
20,0
30,0
40,0
50,0
60,0
ASOC China India Brazil EU-28 USA Americas Other Europe
& CIS
Middle East Africa
RES-E capacity in kWe per GDP (million EUR 2011 PPP)
2005 2010 2015 2016 2017 2018
World Average 2018: 24.6 kWe/GDP (million EUR 2011 PPP)

Eionet Report - ETC/CME 2019/8 61
constant EUR
2011
(PPP) of GDP, it is second only after Brazil at 56.8 kW per unit GDP in million
constant EUR
2011
(PPP).
• Within this group, India performs least well in per capita terms (at 0.09 kW/person, well below the
world average) and per unit GDP (15.5 kW per unit GDP in million constant EUR
2011
(PPP)). Between
2005 and 2018, it enhanced its RES-E capacity by a factor of 2.7, starting from a low base. Despite
that, growth over the period has been relatively modest in terms of capacity per unit GDP, at an
average annual rate of 2 %, but higher for capacity per person, at an average annual rate of 8 %.
In the second group of countries, the EU more than doubled its RES-E capacity over the period 2005-2018,
from 180 GW to 465 GW installed. With 179 GW installed, wind power was the EU’s largest renewable
power source in 2018, followed by hydropower (130 GW, not including pumped storage) and solar PV
energy (115 GW). Wind power and solar PV accounted for 90 % of the annual increase in renewable power
capacity, and offshore wind power represented around 25 % of the total European wind power market in
2018.
• By 2018, the EU had established itself as the clear world leader in per capita RES-E capacity
(0.91 kW/person), which has increased every year starting from 2005. With a compound annual
growth rate of 6.2 % in RES-E capacity per unit GDP over the period 2005-2018, the EU is also
clearly outpacing other regions in transforming the energy resource base of its economic activities.
• In the United States, the installed RES-E capacity amounted to 245 GW in 2018. With 94 GW of
capacity in 2018, wind dominates RES capacity followed by hydro with capacity of 84 GW (not
including pump storage). The United States also scores well in per capita terms (0.75 kW/person),
but the country’s performance per unit GDP (16.9 kW/million EUR
2011
(PPP)) was below the world
average in 2018. Furthermore, most of the growth in this parameter has happened over the period
2005-2010, and it has slowed down over the period 2011-2018.
In the third group of countries, RES-E development has been less prominent to date in the Middle East,
Africa and the Americas (excluding the United States and Brazil). The latter experienced a relatively limited
growth in RES-E capacity over the period 2005-2018 (from 146 to 211 GW), despite some of the countries
with the highest RES-E shares being located in this region (
34
). Concerning the OE-CIS, deployment of RES-
E capacity is still mainly dominated by hydropower (with the Ukraine as a notable exception), although
potential for sizable solar PV and onshore wind development exists throughout the region (Deng et al.,
2015). In 2018, 67 % of the wind capacity and about 49 % of the solar PV capacity of the region existed in
one country, namely Turkey (IRENA, 2018). Solar PV capacity in Turkey increased to 5 063 MW in 2018
from just 833 MW in 2016.
• Comparing the RES-E resource base with the size of the Middle East’s economy reveals this
region’s weak performance on this parameter (4.5 kW per unit of GDP in million constant EUR
2011
(PPP), which is well below the world average). Furthermore, there are no signs yet that the speed
of transforming the energy resource base of the Middle East’s economy is picking up.
• Seen from a per capita perspective, the figure of 0.036 kW/person recorded in Africa is well below
the world average. What is worrisome is that it has remained almost stagnant over the last 5 years.
• The Americas’ (excluding the United States and Brazil) performance on a per capita or per unit
GDP basis is well above the world average, with 0.44 kWe per person and 35.1 kWe per unit of
GDP in million constant EUR
2011
(PPP) in 2018.
4.1.2 Wind and solar photovoltaic capacity deployment
Wind and solar PV energy are among the most progressive renewable energy technologies that are
experiencing strong growth worldwide due to significant cost reductions and further potential for
innovation, technological learning and economies of scale. In 2018, hydropower did no longer account for
(
34
) For example, Costa Rica and Uruguay generated almost 90 % of their electricity from RES in 2017, predominantly
hydropower, although wind power also provided a significant contribution (REN21 2018). In 2018, Costa Rica
powered itself for 300 days on 100 % renewable energy and 36 % of electricity in Uruguay was produced from
wind and solar PV (REN21 2019).

Eionet Report - ETC/CME 2019/8 62
half of the cumulative renewable power capacity in operation. It fell below 48 % by the end of 2018. At
the same time wind power rose to roughly 25 % of the installed renewable power generation capacity,
while solar PV exceeded 20 % for the first time (REN21 2019)..At least 9 countries generated 20 % or more
of their electricity with solar PV and wind power in 2018 (REN21 2019). These two resources contributed
to the total generation for 51 % for Denmark, 36 % for Uruguay, 29 % for Ireland and 26 % for Germany.
With realistic global wind and solar electricity potentials ranging between 730 and 3 700 EJ per year, the
long-term contribution of wind and solar power to the world’s energy supply could far exceed our energy
needs (Deng et al. 2015). Despite impressive growth, only a small fraction of this large potential has been
realised to date. Policy support for technology innovation will remain key to the success. The experience
with onshore wind and solar PV has demonstrated the positive impact of strong and targeted policy
support for technology innovation, delivering substantial cost reductions and rapid investment growth
over the last decade (IEA 2017). While promising, progress with these technologies alone is insufficient to
achieve the maximum potential central to the transformation to a low carbon energy system. Accelerated
technology innovation remains critical to bring forward more advanced technologies, improve technology
performance and decrease costs through technology learning (IEA 2017).
Solar power rose to record prominence in 2018, as the world installed 94 GW of new solar PV power
projects, more than the net additions to fossil fuel and nuclear plants put together. The solar build-out (
35
)
represented 43 % of all new net generating capacity added in 2018 (renewable, fossil fuel and nuclear
energy included; (Frankfurt School-UNEP 2019)). Solar PV accounted for nearly 55 % of newly installed
renewable power capacity in 2018. Wind (29 %) accounted for most of the remaining net added capacity.
Global solar PV and wind capacity (cumulative) in 2018 were 480 GW and 563 GW, respectively (IRENA
2019a). Respective growth in added capacity over the previous year was 24 % and 9.5 %. Solar PV has
become the world’s fastest-growing energy technology, with gigawatt-scale markets in an increasing
number of countries. Eleven countries added more than 1 GW of new capacity during the year, up from
9 countries in 2017 and 7 countries in 2016, and markets around the world have begun to contribute
significantly to global growth. By the end of 2018, at least 32 countries had a cumulative capacity of 1 GW
or more, up from 29 countries one year earlier (REN21 2019). By the end of 2018, enough capacity was in
operation worldwide to produce close to 640 TWh of electricity per year, or an estimated 2.4 % of annual
global electricity generation (REN21 2019). Solar PV already plays a significant and growing role in
electricity generation in several countries. In 2018, it accounted for 12.1 % of total generation in Honduras
and substantial shares also in Italy (nearly 8.2 %), Greece (8.2 %), Germany (7.7 %) and Japan (6.5 %)
(REN21 2019).
Rapidly falling costs per kilowatt-hour (both onshore and offshore) have made wind energy the least-cost
option for new power generating capacity in a large and growing number of markets around the world. As
a result, the economics of wind energy have become the primary driver for new installations. Wind power
provides a substantial share of electricity in a growing number of countries. In 2018, wind energy covered
an estimated 14 % of the EU’s annual electricity consumption and equal or higher shares in at least six
individual member states, including Denmark, which met 40.8 % of its annual electricity consumption with
wind energy (REN21 2019). At least 12 countries around the world met 10 % or more of their annual
electricity consumption with wind energy in 2018, and some – including Costa Rica, Nicaragua and Uruguay
– have seen rapid increases. In Uruguay, the share of generation from wind energy rose more than five-
fold in just four years, from 6.2 % in 2014 to 33 % in 2018. By year’s end, global wind power capacity in
operation was enough to contribute an estimated 5.5 % of total electricity generation. At least 33 countries
have more than 1 GW in operation (REN21 2019).
The EU has contributed significantly to the worldwide demonstration and commercialisation of solar PV
and wind power (see Figure 34, Figure 35 and Table 15). Following the implementation of various market-
pull policy support instruments, the EU has been a clear leader since 2005 in the deployment of these
(
35
) Almost all PV but with a few hundred megawatts of solar thermal.
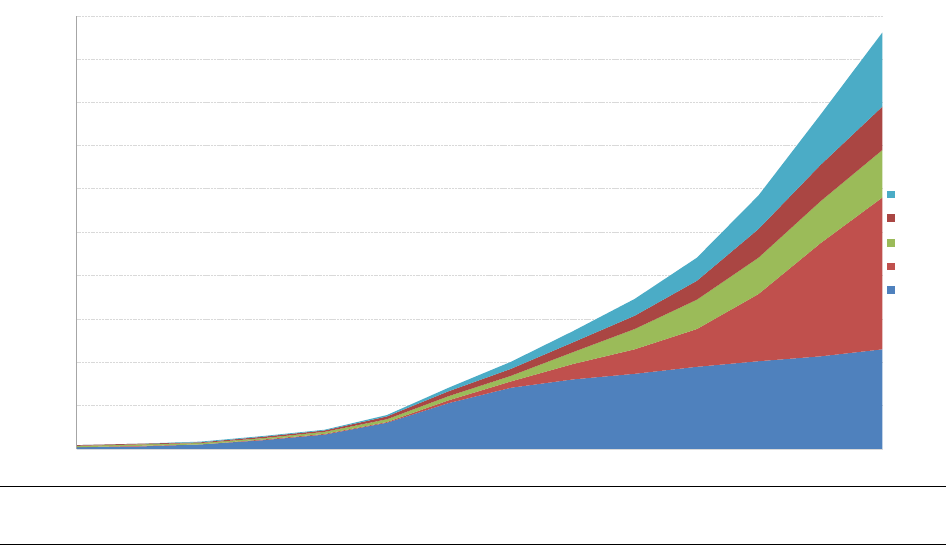
Eionet Report - ETC/CME 2019/8 63
technologies. However, more recently, the growth in solar PV installations has slowed down in the EU,
with capacity increasing by only a modest 7.5 % in 2018 over the previous year, although growth is higher
than the previous year. In 2017, China overtook the EU for the first time as regards installed solar PV
capacity (131 GW), registering a 68 % growth in solar PV over the previous year. In 2018, growth slowed
down to 34 %, contributing to 44 GW of new capacity and cumulative capacity of 175 GW. The EU with
115 GW maintains second position, while other countries remain far behind, e.g., Japan (55.5 GW) and the
United States (49.7 GW). The rest of the world (ROW in the figures) accounted for the remaining 85 GW.
China, the EU, the United States and Japan together account for 82 % of global solar PV capacity.
Growth rates for solar PV capacity installation between 2017 and 2018 in the United States (20 %) and
Japan (13 %) by far surpassed the EU growth rate (7.5 %). It is also worth noting that, since 2010, the pace
of solar PV deployment has been increasing in other parts of the world, with Australia, Canada, India, South
Africa, South Korea and Thailand having contributed significantly to that growth.
Figure 34 Growth in total solar PV capacity in the EU, the top three countries and the rest of the world,
2005-2018
Notes: The figure shows the maximum net generation capacity installed and connected. ROW: rest of the world.
Source: (IRENA 2019a).
Global wind capacity in 2018 was 563 GW (540.3 GW onshore and 23.4 GW offshore), about 9.5 % (49 GW)
higher than the previous year. Outside of China (with a FIT) and the United States (tax credits), most of the
global demand in 2018 resulted from tenders and other market-based policies (REN21 2019). Targets for
renewable energy and for reductions in CO2 emissions also continue to be important drivers of wind power
deployment, as they are for other renewable sources. The offshore wind sector saw a lesser growth of
23 % in new capacity installation in 2018, as compared to 32 % in previous year. China’s offshore market
started to take off in 2017, and in 2018, 40 % of the new global capacity was added in China. The sizes of
turbines and projects continued to increase, and several manufacturers announced plans to produce
machines with capacities of 10 MW and more. In 2018, the largest turbine in the world was installed in the
United Kingdom. Two V164-8.8 MW, with a rotor diameter of 164m, were connected at the European
Offshore Wind Development Centre (EOWDC) wind farm (Wind Europe 2019).
For a long time, the EU has been the leader as far as wind capacity is concerned with an installed capacity
far ahead of the other regions. However, over time (2007-2018), other regions, especially the United States
and China have caught up rapidly to close the capacity gap between them and the EU. In 2018, China first
10
17
30
53
71
80
87
95
101
107
115
0
7
18
28
44
78
131
175
1
7
14
23
34
42
49
56
8
12
15
22
33
41
50
0
8
12
20
27
38
58
85
0
50
100
150
200
250
300
350
400
450
500
2005 2006 2007 2008 2009 2010 2011 2012 2013 2014 2015 2016 2017 2018
GW
ROW
USA
Japan
China
EU28
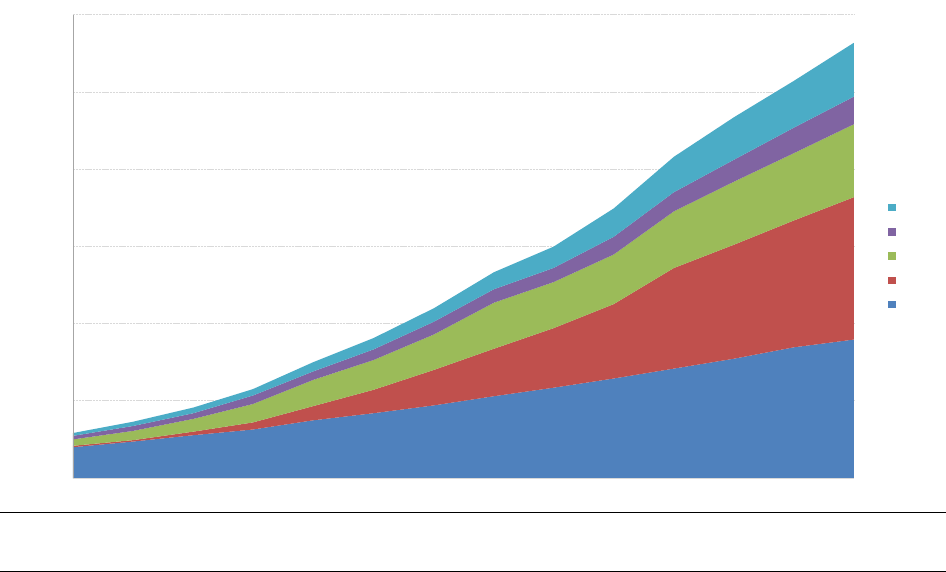
Eionet Report - ETC/CME 2019/8 64
time surpassed EU with 184 GW in 2018, and became the global leader. With 179 GW installed capacity
in 2018, the EU has the second largest installed wind capacity followed by USA (94 GW) and India (35 GW)
(see Figure 35). The EU, China, the United States and India together accounted for 88 % of the total
installed wind power capacity worldwide in 2018. Following a record year for wind power in Europe and
India in 2017, both markets contracted in 2018, but notable growth occurred in several other regions and
countries. Emerging markets across Africa, Southeast Asia, Latin America and the Middle East together
accounted for nearly 10 % of new installations, up from 8 % the previous year (GWEC 2019). New wind
farms reached full commercial operation in at least 47 countries during 2018, and at least three countries
(Bosnia and Herzegovina, Indonesia and Kosovo) brought online their first commercial projects.
Figure 35 Growth in total wind power capacity in the EU, the top three countries and the rest of the
world, 2005-2018
Notes: The figure shows the maximum net generation capacity installed and connected. ROW: rest of the world.
Source: (IRENA 2019a).
4.2 Renewable energy investments
The FS-UNEP 2019 report which is the major source of data in this report, has revised the past renewable
investment data series, so we have updated our data series also. Global investment in renewable energy
has declined in 2018 at EUR 244 billion, 15 % less than the previous year (EUR 288.5 billion). According to
the latest REN 21 report, if investments in hydropower projects larger than 50 MW are included, total new
investment in renewable power and fuels was at least EUR 258 billion in 2018 (REN21 2019), more than
treble the amount invested in the previous decade. Solar is set to have attracted the most in 2010-2019,
at $1.3 trillion, with wind securing $1 trillion and biomass and waste-to-energy $115 billion (Frankfurt
School-UNEP 2019).
The FS-UNEP 2019 report quoted BNEF (Bloomberg New Energy Finance) estimates for fossil and nuclear
as 104 billion euro in total last year – consisting of 34.7 billion euro for coal plants, 41.5 billion euro for
gas-fired capacity, and 28 billion euro for nuclear. If the comparison is just with fossil fuel power, then
renewables attracted three times as much capacity investment in 2018 (Frankfurt School-UNEP 2019).
In 2015, the developing world for the first time invested more in green energy than developed economies.
This trend has continued since then. Renewable energy capacity investment in developing economies
40
47
56
63
75
84
94
106
117
129
141
154
169
179
4
8
18
30
46
62
77
97
131
149
164
185
17
25
34
39
46
59
60
64
73
81
88
9…
8
10
11
13
16
17
18
22
25
29
33
35
7
9
12
15
18
23
28
37
46
54
61
70
0
100
200
300
400
500
600
2005 2006 2007 2008 2009 2010 2011 2012 2013 2014 2015 2016 2017 2018
GW
ROW
India
USA
China
EU28

Eionet Report - ETC/CME 2019/8 65
(124.7 billion euro) outweighed that in developed countries (106.6 billion euro) for the fourth year running
in 2018, but the gap was much smaller than in 2017 due to a sharp drop in spending in China.
China has been by far the largest country for investment in renewable energy excluding large hydro in
every year since 2012, and it maintained its lead in 2018 too, its financing of new capacity, at
79 billion euro, being more than twice the equivalent for the United States, which deployed 39 billion euro
in the same year. However, the Chinese total in 2018 was 40 % down on the 2017 record, and the country’s
lowest since 2014. Decline was due to the solar sector, which saw investment more than halve to
32 billion euro due to shift in policy on feed-in-tariff. However, in 2018 China started the restructuring of
its feed-in tariff programme for utility-scale projects towards a more efficient auction system.
After experiencing a large decline in 2017, Europe saw a 33 % growth in investment in 2018, to
52.7 billion euro. This is largely due to 36 % growth in renewable investment in the United Kingdom
resulting from final investment decisions on several large offshore wind parks and biomass and waste-to-
energy plants. With 7.5 billion euro investment on renewable capacity in 2018, the United Kingdom
remained the largest renewable investor in Europe. However, most spectacular year-on-year change in
Europe came from Spain. Investment there jumped 859 % to 6.3 billion euro, as a new generation of low-
cost solar and wind projects got the go ahead on the back of auctions or private sector power purchase
agreements.
Investment on renewable capacity in ASOC region increased only marginally in 2018 and amounted to
38.5 billion euro. There are two major players in the region, Australia hiked investment in new capacity by
30 % to a record 7.8 billion euro, while Japan experienced a 12 % fall to 14.9 billion euro in 2018. The latter
figure was Japan’s lowest since 2012 and reflected both lower capital costs per MW in solar and an
underlying cooling in capacity additions (Frankfurt School-UNEP 2019).
4.2.1 Share in global renewable energy investments
Throughout the period 2005-2012, Europe (including CIS) (
36
) has dominated global new investments in
renewable energy (see Table 15). However, investment activity spread rapidly to new markets, highlighting
Europe’s pioneering role in developing renewables. In 2013, for the first time, Europe came second as
regards its share in global new investments in renewable energy, with the largest shares in new
investments being taken over by China (27 %). Europe’s share declined further to 13.7 % in 2017 from
24.2 % in the previous year. Since then, China has consolidated its position. In 2017, China registered a
steep jump in its share in global investment in renewable energy to 45.2 % from 35.4 % in 2016. However,
in 2018, China experienced a sharp decline in its share from 45.3 % to 32.3 %, while Europe recovers its
position to some extent as its share increases from 13.7 % to 21.6 %. The share of investments in the
United States has fluctuated around 15 % over the last 5 years. Together, China, Europe (including CIS) and
the United States accounted for approximately 70 % of global new investments in renewable energy
technologies in 2018, four percentage point less than the previous year. ASOC made a 3 percentage points
gain primarily because of enhanced activities in Australia and Japan.
(
36
) CIS refers to the Commonwealth of Independent States. For full details, please see geographical notations in the
glossary.
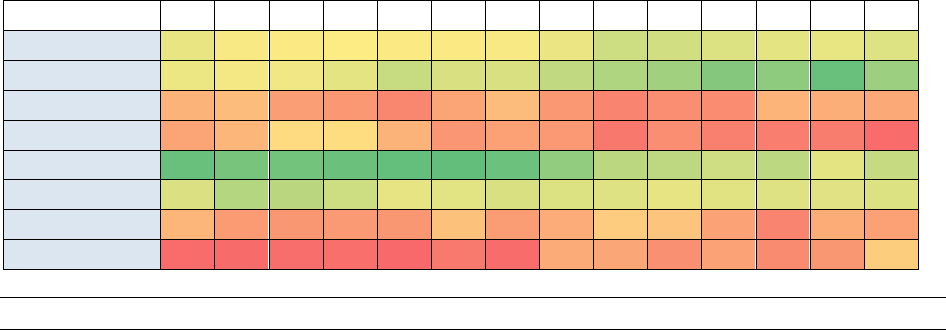
Eionet Report - ETC/CME 2019/8 66
Region
2005
2006
2007
2008
2009
2010
2011
2012
2013
2014
2015
2016
2017
2018
ASOC
12.4
9.0
8.1
7.5
8.1
8.1
8.8
12.1
19.8
18.5
15.9
13.6
12.8
15.7
China
12.0
9.8
10.6
13.9
21.4
17.0
16.7
22.8
27.2
31.1
38.2
35.7
45.3
32.3
India
4.4
4.8
3.4
3.1
2.4
3.7
4.8
3.1
2.2
2.7
2.6
4.4
4.2
4.0
Brazil
3.7
4.5
6.2
6.3
4.4
3.0
3.5
3.2
1.7
2.7
2.0
1.9
1.9
1.2
Europe (incl. CIS)
45.5
41.6
42.6
44.8
46.3
46.8
44.6
34.8
24.5
24.0
19.3
24.2
13.7
21.6
USA
16.4
26.0
24.8
19.8
13.4
14.5
17.1
15.9
15.4
13.2
14.8
15.4
14.9
16.1
Americas
4.5
3.3
3.1
3.2
3.1
5.1
3.3
4.1
5.5
5.2
3.6
2.2
4.1
3.5
Middle East & Africa
1.1
1.1
1.2
1.3
1.0
1.7
1.1
4.0
3.8
2.8
3.6
2.5
3.1
5.6
Table 15 Share of global new investments (%) in renewable energy per region, 2005-2018
Notes:
(1) ASOC refers to Asia and Oceania; CIS refers to the Commonwealth of Independent States; full information about geographical
coverage and regional aggregations is provided in the glossary. Dark green indicates the band with the highest shares; red denotes
the band with the lowest; yellow denotes the midpoint percentile.
(2) graded color scale from red (lowest share) to green (highest share) in one year
Source: (Frankfurt School-UNEP 2019).
4.2.2 Growth in renewable energy investments
Between 2005 and 2008, renewable energy investments saw a steady increase in most global regions. In
2008 and 2009, the economic crisis affected liquidities and, therefore, renewable energy investments
increased less than in previous years. Although investments recovered shortly after the crisis, in 2012, for
the first time, there was a decline in global investments in renewable energy. This took place against the
backdrop of developments and significant cost reductions in certain technologies, policy uncertainties and
retroactive policy changes (in Europe, where most investments were taking place, and in the United States,
which had the second to third largest investments between 2005 and 2014), low natural gas prices in the
United States and somewhat slower economic activity globally.
Taking into account the period from 2005 to 2011, in which policy uncertainty was low, the strongest
average annual growth in renewable energy investments was distributed as follows: China (30 %), United
States (25 %) and India (25 %). After difficult years in 2012-2013 (with declining or even negative growth
in most regions), investments in renewables took a positive turn again in 2014-2015. In 2015, a new record
in global investments was achieved. In 2016, however, global investments dropped significantly (by 7 %),
despite the fact that a new record in added capacity (160 GW) was achieved. There are two main reasons
for the decline in global investment in renewable energy during 2016 (Frankfurt School-UNEP 2019).
The first is the slowdown in investments in China (-20 %), ASOC (-30 %, mainly caused by a slowdown in
investments in Japan) and some other emerging countries (Americas -47 %; Middle East and Africa -32 %).
The second is the significant reductions in the costs of solar PV, and onshore and offshore wind power,
which also improved the cost-competitiveness of those technologies. The result was that, in 2016,
investors were able to acquire more renewable energy capacity for less money. Total investment in 2017
registered 8 % growth over 2016 and marginally higher than the peak investment happened in 2015.
However, in 2018, there is sharp fall (15 %) in investment mainly caused by China, as explained above.
Overall, Figure 36 shows the following trend: in every single year between 2005 and 2012, Europe
(including CIS) was the region with the highest new renewable energy investments. Since 2013, China has
taken over and, despite the setback in 2016, and then again in last year 2018, is still the clear world leader
in investments in renewable energy.
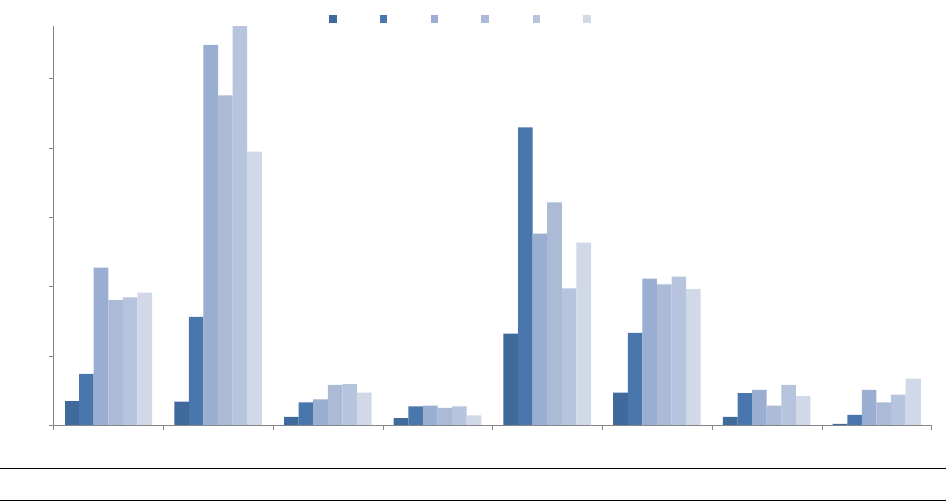
Eionet Report - ETC/CME 2019/8 67
Figure 36 Total new investments in renewable energy by region, 2005-2018
Notes: Figures converted to euros using annual exchange rates from the Eurostat database. ASOC refers to Asia (excluding India
and China) and Oceania; CIS refers to the Commonwealth of Independent States; full information about the geographical coverage
and regional aggregations is provided in the glossary.
Sources: (Eurostat 2019b); (Frankfurt School-UNEP 2019)
0
20
40
60
80
100
ASOC China India Brazil Europe (incl. CIS) USA Americas Middle East & Africa
Billion EUR
2005 2010 2015 2016 2017 2018
Global investments in 2018: 244 billion EUR
Eionet Report - ETC/CME 2019/8 68
4.2.3 Total new investments by technology
New investments in renewable energy in 2017 continued to be dominated by solar energy (mostly solar
PV), accounting for 49 % of total investment in renewables, however, at a much lower share than in the
previous year (55%). Wind power holds the second position, having a slightly higher share in 2017 (46 %)
than in previous years (Frankfurt School-UNEP 2019). Both of these technologies received policy support
— to varying extents — and experienced rapid technological learning that led to growing confidence on
the part of investors. Over the period 2005-2015, total new investments in technology grew fastest for
solar energy; there was an overall sharp decline in 2016, but in 2017 investment picked up again and
reached 160 billion euro (about 28 billion euro higher than 2016). In 2018 however, investment came
down heavily again, to 119.6 billion euro (see Figure 37).
From 2005 to 2009, investments in wind power grew rapidly and made up the largest share of total
investments. In 2010, it has the same share as solar energy. In 2011, it lost its dominance as investment
declined substantially to 62.7 billion euro from 76.6 billion euro in the previous year. The subsequent two
years until 2013, its share declined and investment remained significantly less than investment in solar PV
during those years. Thereafter, investment picked up and peaked at 115 billion euro in 2017, but fell
slightly again in 2018. Worries about curtailment and declining feed-in tariff rates contributed to the
slowdown, but China remained the biggest onshore wind market in terms of new installations.
In 2015, emerging and developing economies accounted for more than half of global investment in both
wind and solar power, but in 2016, they lost the lead in wind power and only narrowly maintained it in
solar power. Developed economies led in both solar (54.7 billion euro) and wind power (52.5 billion euro)
investment in 2018, followed by China (REN21 2019). Respective investments on solar and wind by China
are 34 billion euro and 42.4 billion euro. Other developing and emerging economies invested significantly
more in solar power (29.7 billion euro) than in wind power (18.6 billion euro) during the year.
Investment in other renewable technologies, e.g. biomass/waste-to-energy, small-scale hydropower and
geothermal power, remained relatively small over the period 2005-2018. Biofuels experienced a steady
growth in new investment from 2005 to 2007, when growth in first-generation biofuels was increasing.
After 2008, investments in biofuels started to decline and fluctuate at lower levels. In 2018, investment
was much lower than in 2005, the year when it peaked. Plateauing of first-generation capacity may explain
this decline, including uncertainties over future legislation, the delayed development of second-generation
biofuels and costs. Small hydro saw an 82 % fall to 0.8 billion euro in 2018. Investment in geothermal
power remained between 1 and 2 billion euro during 2005-2018.
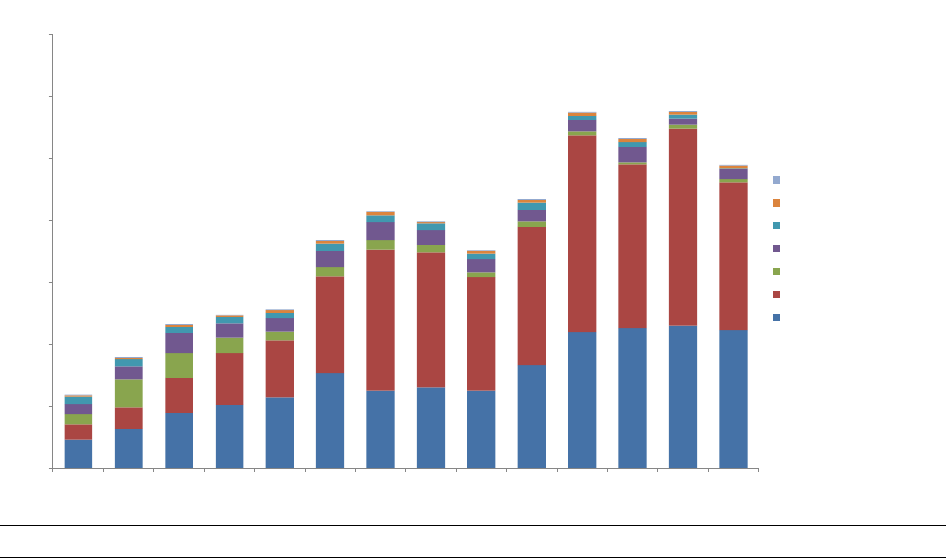
Eionet Report - ETC/CME 2019/8 69
Figure 37 Total global new investment by technology, 2005-2018
Source: (Frankfurt School-UNEP 2019).
4.3 Renewable energy employment
In 2018, a total of 11 million jobs (direct and indirect) were related to renewable energies globally (IRENA
2019b). Women represent 32 % of the total renewable energy workforce, whereas they account for only
22 % of the oil and gas workforce (REN21 2019). The regional distribution of these jobs is depicted in Figure
38. Similar to the previous year China, the EU and Brazil were the largest employers in absolute terms (grey
bars in Figure 38). Figure 38 also presents renewable jobs in relative terms (i.e. renewable energy related
jobs as the percentage share of the total labour force in the country — the blue-hatched bars in Figure 38)
by region:
• Brazil, China and the USA are the top three countries/regions with respect to renewable energy-
related jobs as percentages of the labour force in 2018, with the EU coming in just behind in fourth
place.
• Within the EU, Germany was the number one per capita (labour force) employer (with 0.67 % of
the total labour force working in the renewables sector).
• At the global level, on average 0.3 % of the labour force is engaged in the renewable energy sector.
In the EU, the largest employers are the solid biomass, wind, and liquid biomass industries. The total
estimated employment of direct and indirect jobs in renewable energy remained virtually the same in 2017
compared to 2016. However, this stable figure covers fluctuations among technologies and countries. Five
countries — Germany, Spain, France, the United Kingdom, and Italy — top the job rankings in most
renewable energy sectors. Employment grew in liquid biofuels but declined in all other renewables
industries. According to EurObserv’ER, employment within the EU in the biofuels sector has increased from
205 100 to 230 400 FTE, a 12 % year-on-year growth. Due to the increasing demand, across the board, all
biofuel sectors grew in 2017 but biodiesel (including HVO synthetic biodiesel) gained the most traction
with 10 % growth on its 2016 level (EurObserv’ER 2018b). Germany remained the leader in Europe. Job
losses in solar PV installations and module manufacturing have been compensated for by increased
employment in geothermal, wind and solid biomass power.
0
50
100
150
200
250
300
350
2005 2006 2007 2008 2009 2010 2011 2012 2013 2014 2015 2016 2017 2018
Billion EUR
Marine
Geothermal
Small hydro
Biomass & waste to energy
Biofuels
Solar
Wind

Eionet Report - ETC/CME 2019/8 70
Figure 38 Direct and indirect jobs related to renewable energy in 2018 by region
Notes: The primary y-axis displays absolute numbers (thousands of jobs) in 2018. The secondary y-axis relates the absolute
number of jobs to the total labour force of each region, thus displaying jobs in the renewable energy sector as percentages of the
total labour force. The jobs displayed include both direct and indirect jobs along the value chain. For Bangladesh, job data in the
solar industry is taken from IRENA (2019b), whereas, job data for other industries are sourced from IRENA in the previous year
(2017a). The jobs data for the EU and its Member States are for 2017, the most recent year for which such information is available.
Sources: Absolute job (IRENA 2018b),(IRENA 2019b); data on labour force (World Bank 2019a).
0,52 %
1,06 %
0,52 %
0,14 %
0,22 %
0,40 %
0,50 %
0,18 %
0,0 %
0,2 %
0,4 %
0,6 %
0,8 %
1,0 %
1,2 %
0
500
1 000
1 500
2 000
2 500
3 000
3 500
4 000
4 500
China Brazil USA India Bangladesh Japan EU-28 ROW
Thousands
Renewable Jobs by region (primary axis) in thousand Jobs by region per person in labor force (secondary axis)
Average jobs by world per person in labour force: 0.3 %
Eionet Report - ETC/CME 2019/8 71
5 Glossary and abbreviations
Abbreviations
Name
CHP
Combined heat and power
CSP
Concentrated solar power
EEA
European Environment Agency
EED
Energy Efficiency Directive (Directive 2012/27/EU of the European Parliament and of the
Council of 25 October 2012 on energy efficiency, amending Directives 2009/125/EC and
2010/30/EU and repealing Directives 2004/8/EC and 2006/32/EC) (see also EU, 2012)
EJ
Exajoule (one quintillion joules)
ENTSO-E
European Network of Transmission System Operators for Electricity
EPBD
Energy Performance of Buildings Directive (Directive 2010/31/EU on the energy performance
of buildings) (see also EU, 2010)
ETC/ACM
European Topic Centre for Air Pollution and Climate Change Mitigation. The ETC/ACM is a
consortium of European institutes contracted by the EEA to carry out specific tasks in the field
of air pollution and climate change.
ETS
Emissions Trading System
EU
European Union
EU-28
Austria, Belgium, Bulgaria, Croatia, Cyprus, Czech Republic, Denmark, Estonia, Finland, France,
Germany, Greece, Hungary, Ireland, Italy, Latvia, Lithuania, Luxembourg, Malta, Netherlands,
Poland, Portugal, Romania, Slovenia, Slovakia, Spain, Sweden, United Kingdom
Final Non-Energy
Consumption
Non-energy use (or consumption) covers those fuels that are used as raw materials in the
different sectors and are not consumed as a fuel or transformed into another fuel
GDP
Gross domestic product
GFEC
Gross final energy consumption means the energy commodities delivered for energy purposes
to industry, transport, households, services — including public services, agriculture, forestry
and fisheries — as well as the consumption of electricity and heat by the energy branch for
electricity and heat production, and including losses of electricity and heat in distribution and
transmission (see Article 2(f) of Directive 2009/28/EC, the Renewable Energy Directive). It
excludes transformation losses, which are included in gross inland energy consumption (GIEC).
In calculating a Member State’s GFEC for the purpose of measuring its compliance with the
targets and interim Renewable Energy Directive (RED) and national renewable energy action
plan (NREAP) trajectories, the amount of energy consumed in aviation shall, as a proportion
of that Member State’s GFEC, be considered to be no more than 6.18 % (4.12 % for Cyprus
and Malta)
GHG
Greenhouse gas
GIC
Gross Inland Consumption; see GIEC
GIEC
Gross Inland Energy Consumption, sometimes shortened to Gross Inland Consumption, is the
total energy demand of a country or region. It represents the quantity of energy necessary to
satisfy inland consumption of the geographical entity under consideration
GW
Gigawatt
GWe
Gigawatt electrical (referring to capacity)
IEA
International Energy Agency
ILUC
Indirect land use change, in the context of Directive (EU) 2015/1513 of the European
Parliament and of the Council, of 9 September 2015, amending Directive 98/70/EC relating to
the quality of petrol and diesel fuels and amending Directive 2009/28/EC on the promotion of
the use of energy from renewable sources (see also EU, 2015)
IRENA
International Renewable Energy Agency
Eionet Report - ETC/CME 2019/8 72
ktoe
Kilotonnes of oil equivalent
kWe
Kilowatt electrical (capacity)
LULUCF
Land use, land use change and forestry — a term used in relation to the forestry and
agricultural sector in the international climate negotiations under the United Framework
Convention on Climate Change (UNFCCC)
Mt
Million tonnes (megatonnes)
Mtoe
Million tonnes of oil equivalent
MW
Megawatt
NREAP
National renewable energy action plan
PEC
Primary energy consumption. In the context of the EED, this represents GIEC minus Final Non-
Energy Consumption
PPA
Power Purchase Agreement. A Power Purchase Agreement (PPA) secures the payment stream
for a Build-Own Transfer (BOT) or concession project for an independent power plant (IPP). It
is between the purchaser "offtaker" (often a state-owned electricity utility) and a privately
owned power producer (World Bank)
OECD
Organisation for Economic Co-operation and Development
PV
(Solar) photovoltaic (energy)
RED
Renewable Energy Directive (Directive 2009/28/EC of the European Parliament and of the
Council of 23 April 2009 on the promotion of the use of energy from renewable sources and
amending and subsequently repealing Directives 2001/77/EC and 2003/30/EC) (see also EU,
2009)
RED II
As part of the Clean Energy for all Europeans initiative (November 2016), the Commission
adopted a legislative proposal for a recast of the RED. The European Parliament and the EU
Council proposed amendments and a final compromise was agreed among the EU institutions
on 14 June 2018. The RED II is expected to be officially adopted by the end of 2018.
Renewable
waste
The biodegradable fraction of industrial and municipal waste
RES
Renewable energy sources
RES-E
Renewable electricity
RES-H&C
Renewable heating and cooling
RES-T
Renewable energy consumed in transport
RET
Renewable energy technology
SHARES
Short Assessment of Renewable Energy Sources. A tool developed by Eurostat with the aim of
facilitating the calculation of the RES share according to the RED
SPF
Seasonal performance factor
UNFCCC
United Nations Framework Convention on Climate Change

Eionet Report - ETC/CME 2019/8 73
Geographical coverage in Chapter 4
The presentation of the global picture in Chapter 4 follows, as far as possible, the geographic coverage and
regional aggregation used by the International Energy Agency (IEA). For investments, the aggregation used
by Frankfurt School-UNEP (Frankfurt School-UNEP, 2018) was used, given that a finer corresponding
aggregation was not available.
Africa
Includes Algeria; Angola; Benin; Botswana (from 1981); Cameroon; Congo; Côte d’Ivoire;
Democratic Republic of the Congo; Egypt; Eritrea; Ethiopia; Gabon; Ghana; Kenya; Libya;
Mauritius; Morocco; Mozambique; Namibia (from 1991); Niger (from 2000); Nigeria;
Senegal; South Africa; South Sudan; Sudan*; United Republic of Tanzania; Togo; Tunisia;
Zambia; Zimbabwe and Other Africa. Other Africa includes Botswana (until 1980); Burkina
Faso; Burundi; Cape Verde; Central African Republic; Chad; Comoros; Djibouti; Equatorial
Guinea; The Gambia; Guinea; Guinea-Bissau; Lesotho; Liberia; Madagascar; Malawi; Mali;
Mauritania; Namibia (until 1990); Niger (until 1999); Réunion; Rwanda; São Tomé and
Príncipe; Seychelles; Sierra Leone; Somalia; Swaziland; and Uganda.
*South Sudan became an independent country on 9 July 2011. From 2012 onwards, data
for South Sudan have been reported separately.
Americas
Consisting of OECD Americas (Canada; Chile; Mexico; and the United States) and non-
OECD Americas (Argentina; Bolivia; Brazil; Colombia; Costa Rica; Cuba; Curaçao*;
Dominican Republic; Ecuador; El Salvador; Guatemala; Haiti; Honduras; Jamaica;
Nicaragua; Panama; Paraguay; Peru; Trinidad and Tobago; Uruguay; Venezuela; and Other
non-OECD Americas). Other non-OECD Americas includes Antigua and Barbuda; Aruba;
Bahamas; Barbados; Belize; Bermuda; British Virgin Islands; Cayman Islands; Dominica;
Falkland Islands (Islas Malvinas); French Guiana; Grenada; Guadeloupe; Guyana;
Martinique; Montserrat; Puerto Rico (for natural gas and electricity); Saint Kitts and Nevis;
Saint Lucia; Saint Pierre and Miquelon; Saint Vincent and the Grenadines; Suriname; Turks
and Caicos Islands; Bonaire (from 2012); Saba (from 2012); Saint Eustratius (from 2012);
and Sint Maarten (from 2012).
*Netherlands Antilles was dissolved on 10 October 2010, resulting in two new constituent
countries, Curaçao and Sint Maarten, with the remaining islands joining the Netherlands
as special municipalities. In this edition, the methodology for accounting for the energy
statistics of Netherlands Antilles has been revised to follow the above-mentioned
geographical changes. From 2012 onwards, data account for the energy statistics of
Curaçao only. Prior to 2012, data remain unchanged and still cover the entire territory of
the former Netherlands Antilles.
ASOC
Asia and Oceania, including OECD Asia and Oceania (Australia; Israel; Japan; South Korea;
and New Zealand) and Asia (Bangladesh; Brunei; Cambodia (from 1995); India; Indonesia;
North Korea; Malaysia; Mongolia (from 1985); Myanmar/Burma; Nepal; Pakistan;
Philippines; Singapore; Sri Lanka; Chinese Taipei; Thailand; Vietnam; and Other Asia.
Other Asia includes Afghanistan; Bhutan; Cambodia (until 1994); China; Cook Islands; Fiji;
French Polynesia; Kiribati; Laos; Macau, Maldives; Mongolia (until 1984); New Caledonia;
Palau (from 1994); Papua New Guinea; Samoa; Solomon Islands; Timor-Leste; Tonga; and
Vanuatu).
Other Europe
and CIS
(Commonwealth
of Independent
States) (OE-CIS)
Albania; Andorra; Armenia; Azerbaijan; Belarus; Bosnia and Herzegovina; Channel Islands;
Georgia; Iceland; Isle of Man; Kazakhstan; Kosovo*; Kyrgyzstan; Liechtenstein; the Former
Yugoslav Republic of Macedonia; Moldova; Monaco; Montenegro; Norway; Russia; San
Marino; Serbia; Switzerland; Tajikistan; Turkey; Turkmenistan; Ukraine; and Uzbekistan.
*Under United Nations Security Council Resolution 1244/99.
Middle East
Bahrain; Iran; Iraq; Jordan; Israel; West Bank Gaza Strip; Kuwait; Lebanon; Oman; Qatar;
Saudi Arabia; Syria; United Arab Emirates; and Yemen.
Eionet Report - ETC/CME 2019/8 74
6 References
COWI et al. 2018. “Feasibility Study on Options to Step up EU Action against Deforestation.”
http://ec.europa.eu/environment/forests/pdf/feasibility_study_deforestation_kh0418199enn_
main_report.pdf.
Deng, Yvonne Y., Martin Haigh, Willemijn Pouwels, Lou Ramaekers, Ruut Brandsma, Sven Schimschar, Jan
Grözinger, and David de Jager. 2015. “Quantifying a Realistic, Worldwide Wind and Solar Electricity
Supply.” Global Environmental Change 31 (March): 239–52.
https://doi.org/10.1016/j.gloenvcha.2015.01.005.
EC. 2001. “Assessment of Plans and Projects Significantly Affecting Natura 2000 Sites.” European
Commission.
https://ec.europa.eu/environment/nature/natura2000/management/docs/art6/natura_2000_as
sess_en.pdf.
———. 2011. “Wind Energy Developments and Natura 2000.” European Commission.
http://ec.europa.eu/environment/nature/natura2000/management/docs/Wind_farms.pdf.
———. 2014. “The EU Birds and Habitats Directives.” European Commission.
http://ec.europa.eu/environment/nature/info/pubs/docs/brochures/nat2000/en.pdf.
———. 2015. Communication from the Commission to the European Parliament, the Council, the European
Economic and Social Committee the Committee of the Regions and the European Investment Bank
— State of the Energy Union 2015. http://ec.europa.eu/priorities/energy-union/state-energy-
union/docs/communication-state-energy-union_en.pdf.
———. 2018. “Guidance Document on The Requirements for Hydropower in Relation to Natura 2000.”
http://ec.europa.eu/environment/nature/natura2000/management/docs/Hydro%20final%20Ma
y%202018.final.pdf.
———. 2019a. “COMMUNICATION FROM THE COMMISSION TO THE EUROPEAN PARLIAMENT, THE
COUNCIL, THE EUROPEAN ECONOMIC AND SOCIAL COMMITTEE AND THE COMMITTEE OF THE
REGIONS United in Delivering the Energy Union and Climate Action - Setting the Foundations for
a Successful Clean Energy Transition.” COM(2019) 285 final. European Commission.
https://ec.europa.eu/energy/sites/ener/files/documents/recommondation_en.pdf.
———. 2019b. “COMMUNICATION FROM THE COMMISSION TO THE EUROPEAN PARLIAMENT, THE
EUROPEAN COUNCIL, THE COUNCIL, THE EUROPEAN ECONOMIC AND SOCIAL COMMITTEE, THE
COMMITTEE OF THE REGIONS AND THE EUROPEAN INVESTMENT BANK A Clean Planet for All A
European Strategic Long-Term Vision for a Prosperous, Modern, Competitive and Climate Neutral
Economy COM/2018/773 Final.” COM/2018/773 final. European Commission. https://eur-
lex.europa.eu/legal-content/EN/TXT/?uri=CELEX:52018DC0773.
———. 2019c. “REPORT FROM THE COMMISSION TO THE EUROPEAN PARLIAMENT, THE COUNCIL, THE
EUROPEAN ECONOMIC AND SOCIAL COMMITTEE AND THE COMMITTEE OF THE REGIONS on the
Status of Production Expansion of Relevant Food and Feed Crops Worldwide.” COM(2019) 142
final. European Commission.
Ecofys. 2014. “Renewable Energy Progress and Biofuels Sustainability.” Utrecht, the Netherlands: Ecofys.
———. 2019. “Technical Assistance in Realisation of the 4th Report on Progress of Renewable Energy in
the EU.” Utrecht, the Netherlands: Ecofys.
https://ec.europa.eu/energy/sites/ener/files/documents/technical_assistance_in_realisation_of
_the_4th_report_on_progress_of_renewable_energy_in_the_eu-final_report.pdf.
EEA. 2015. “Renewable Energy in Europe — Approximated Recent Growth and Knock-on Effects.”
Technical Report No 1/2015. European Environment Agency.
http://www.eea.europa.eu/publications/renewable-energy-in-europe-approximated.
———. 2018a. “Renewable Energy in Europe – 2018.” EEA Report No 20/2018. European Environment
Agency. https://www.eea.europa.eu/publications/renewable-energy-in-europe-2018.
———. 2018b. “Trends and Projections in Europe 2018.” EEA Report No 16/2018. European Environment
Agency. https://www.eea.europa.eu/publications/trends-and-projections-in-europe-2018/.
———. 2019. “Trends and Projections in Europe 2019.” EEA Report No 15/2019. European Environment
Agency. https://www.eea.europa.eu/publications/trends-and-projections-in-europe-1.
Eionet Report - ETC/CME 2019/8 75
ETC/CME. 2019a. “Data Annexes - Results of Implied Emission Factors per Member State Based on GAINS
Data to Eionet Report - ETC/CME 2019/2.” Eionet Report-ETC/CME 2019/2. European Topic Centre
on Climate Change Mitigation and Energy. https://www.eionet.europa.eu/etcs/etc-
cme/products/etc-cme-reports/impacts-of-renewable-energy-on-air-pollutant-emissions.
———. 2019b. “Impacts of Renewable Energy on Air Pollutant Emissions.” ETC/CME Report 2019/2.
European Topic Centre on Climate Change Mitigation and Energy.
https://www.eionet.europa.eu/etcs/etc-cme/products/etc-cme-reports/impacts-of-renewable-
energy-on-air-pollutant-emissions.
EU. 2009. Directive 2009/28/EC of the European Parliament and of the Council of 23 April 2009 on the
Promotion of the Use of Energy from Renewable Sources and Amending and Subsequently
Repealing Directives 2001/77/EC and 2003/30/EC (OJ L 140, 5.6.2009, p. 16-62).
———. 2010. Directive 2010/31/EU of the European Parliament and of the Council of 19 May 2010 on the
Energy Performance of Buildings (OJ L 153, 18.6.2010, p. 13-35).
———. 2012. Directive 2012/27/EU of the European Parliament and of the Council of 25 October 2012 on
Energy Efficiency, Amending Directives 2009/125/EC and 2010/30/EU and Repealing Directives
2004/8/EC and 2006/32/EC (OJ L 315, 14.11.2012, p. 1-56).
———. 2015a. Directive (EU) 2015/1513 of the European Parliament and of the Council of 9 September
2015 Amending Directive 98/70/EC Relating to the Quality of Petrol and Diesel Fuels and Amending
Directive 2009/28/EC on the Promotion of the Use of Energy from Renewable Resources (OJ L
239/1, 15.9.2015, p. 1-29).
———. 2015b. Directive (EU) 2015/1513 of the European Parliament and of the Council of 9 September
2015 Amending Directive 98/70/EC Relating to the Quality of Petrol and Diesel Fuels and Amending
Directive 2009/28/EC on the Promotion of the Use of Energy from Renewable Resources (OJ L
239/1, 15.9.2015, p. 1-29).
———. 2018a. Directive (EU) 2018/2001 of the European Parliament and of the Council of 11 December
2018 on the Promotion of the Use of Energy from Renewable Sources (OJ L 328, 21.12.2018, p. 82–
209).
———. 2018b. Regulation (EU) 2018/1999 of the European Parliament and of the Council of 11 December
2018 on the Governance of the Energy Union and Climate Action, Amending Regulations (EC) No
663/2009 and (EC) No 715/2009 of the European Parliament and of the Council, Directives
94/22/EC, 98/70/EC, 2009/31/EC, 2009/73/EC, 2010/31/EU, 2012/27/EU and 2013/30/EU of the
European Parliament and of the Council, Council Directives 2009/119/EC and (EU) 2015/652 and
Repealing Regulation (EU) No 525/2013 of the European Parliament and of the Council (OJ L 328,
21.12.2018, p. 1–77 ).
EurObserv’ER. 2017. “Biogas Barometer 2017.” EurObserv’ER. http://www.energies-
renouvelables.org/observ-er/stat_baro/observ/baro224_Biogas_en.pdf.
———. 2018a. “Heat Pumps Barometer 2018.” EurObserv’ER. https://www.eurobserv-er.org/heat-
pumps-barometer-2018/.
———. 2018b. “The State of Renewable Energies in Europe. Edition 2018.” EurObserv’ER.
https://www.eurobserv-er.org/category/2018/.
———. 2019a. “Photovoltaic Barometer 2019.” Eurobserv’ER. https://www.eurobserv-
er.org/photovoltaic-barometer-2019/.
———. 2019b. “Solarthermal and Concentrated Solar Power Barometer 2019.” EurObserv’ER.
https://www.eurobserv-er.org/solar-thermal-and-concentrated-solar-power-barometer-2019/.
———. 2019c. “Wind Energy Barometer 2019.” EurObserv’ER. https://www.eurobserv-er.org/wind-
energy-barometer-2019/.
Eurostat. 2019a. “Eurostat - Complete Energy Balances - Nrg_bal_c.” 2019.
https://appsso.eurostat.ec.europa.eu/nui/show.do?dataset=nrg_bal_c&lang=en.
———. 2019b. “Eurostat, Exchange Rate Database, European Commission.
Http://Ec.Europa.Eu/Eurostat/Web/Exchange-Rates/Data/Database.”
https://ec.europa.eu/eurostat/web/exchange-and-interest-rates/data/database.
———. 2019c. “Eurostat, Population on 1 January by Age and Sex, European Commission.”
http://appsso.eurostat.ec.europa.eu/nui/submitViewTableAction.do.
Eionet Report - ETC/CME 2019/8 76
———. 2019d. “SHARES 2017: Short Assessment of Renewable Energy Sources.” 2019.
http://ec.europa.eu/eurostat/web/energy/data/shares.
Frankfurt School-UNEP. 2019. “Global Trends in Renewable Energy Investment 2019.”
https://wedocs.unep.org/bitstream/handle/20.500.11822/29752/GTR2019.pdf?sequence=1&isA
llowed=y.
GWEC. 2019. “Global Wind Report 2018.” https://gwec.net/global-wind-report-2018/.
IEA. 2017. “Energy Technology Perspectives.” Paris; International Energy Agency.
https://www.iea.org/etp/.
———. 2019a. “Renewable Capacity Growth Worldwide Stalled in 2018 after Two Decades of Strong
Expansion.” 2019. https://www.iea.org/newsroom/news/2019/may/renewable-capacity-growth-
worldwide-stalled-in-2018-after-two-decades-of-strong-e.html.
———. 2019b. “World Energy Outlook 2019.” Paris; International Energy Agency.
https://www.iea.org/reports/world-energy-outlook-2019.
IIASA. 2017. GAINS Dataset, Scenario WPE2014-CLE. IIASA.
IMF. 2019. “World Economic Outlook Database.”
Https://Www.Imf.Org/External/Pubs/Ft/Weo/2018/01/Weodata/Weoselco.Aspx?G=2001&sg=Al
l+countries. 2019.
International Hydropower Association. 2019. “2019 Hydropower Status Report.”
https://www.hydropower.org/status2019.
IRENA. 2016. “The Power to Change: Solar and Wind Cost Reduction Potential to 2025.”
http://www.irena.org/costs.
———. 2018a. “Renewable Capacity Statistics 2018.” IRENA.
http://www.irena.org/publications/2018/Mar/Renewable-Capacity-Statistics-2018.
———. 2018b. “Renewable Energy and Jobs – Annual Review 2018.” IRENA.
http://irena.org/publications/2018/May/Renewable-Energy-and-Jobs-Annual-Review-2018.
———. 2019a. “Renewable Capacity Statistics 2019.” IRENA.
https://www.irena.org/publications/2019/Mar/Renewable-Capacity-Statistics-2019.
———. 2019b. “Renewable Energy and Jobs – Annual Review 2019.” IRENA.
https://www.irena.org/publications/2019/Jun/Renewable-Energy-and-Jobs-Annual-Review-
2019.
Kampman, B., S. Sina, C. Lucha, S. Cesbron, Z. Pato, and O. Flörcken. 2015. “Mid-Term Evaluation of the
Renewable Energy Directive. A Study in the Context of the REFIT Programme.” Delft, Netherlands:
CE Delft.
OECD. 2019. “OECD Data on Exchange Rates.” Https://Data.Oecd.Org/Conversion/Exchange-
Rates.Htm#indicator-Chart. 2019.
PWC et al. 2017. “Sustainable and Optimal Use of Biomass for Energy in the EU beyond 2020, Final Report.”
https://ec.europa.eu/energy/sites/ener/files/documents/biosustain_report_final.pdf.
REN 21. 2017. “Renewables 2017. Global Status Report.” Paris, France: Renewable Energy Policy Network
for the 21st Century.
REN21. 2018. “Renewables 2018. Global Status Report.” Renewable Energy Policy Network for the 21st
Century. http://www.ren21.net/status-of-renewables/global-status-report/.
———. 2019. “Renewables 2019. Global Status Report.” Renewable Energy Policy Network for the 21st
Century. http://ren21.net/gsr-2019/?gclid=Cj0KCQjwvo_qBRDQARIsAE-
bsH8EGmzNGpqy4MM6siBxqUc-v12xqoTp1yCgdVfWaP9_nM4pOsKcPkAaAkKnEALw_wcB.
Roland Berger. 2016. “Onshore Wind Power - Playing the Game by New Rules in a Mature Market.” Think
Act.
SmartPowerIndia. 2017. “Expanding Opportunities for Renewable Energy-Based Mini-Grids in Rural India.”
SmartPowerIndia, powered by Rockefeller Foundation.
http://www.smartpowerindia.org/media/1137/smartpowerindia_report_april_2017.pdf.
UN. 2019. “UN Population Division, 2019, World Population Prospects.” UN.
———. 2019a. “Sustainable Development Goals.” December 13, 2019.
https://sustainabledevelopment.un.org/?menu=1300.
Eionet Report - ETC/CME 2019/8 77
———. 2019b. “Sustainable Energy for All - Understanding SDG7.” December 13, 2019.
https://www.seforall.org/understanding-sdg7.
UNFCCC. 2015. “Paris Agreement.” UNFCCC. https://unfccc.int/process-and-meetings/the-paris-
agreement/the-paris-agreement.
Wind Europe. 2019. “Wind Energy in Europe in 2018 - Trends and Statistics.” Wind Europe.
https://windeurope.org/wp-content/uploads/files/about-wind/statistics/WindEurope-Annual-
Statistics-2018.pdf.
World Bank. 2019a. “Labor Force Statistics.” 2019. https://data.worldbank.org/indicator/SL.TLF.TOTL.IN.
———. 2019b. “National GDP Statistics.” 2019. http://data.worldbank.org/indicator/NY.GDP.MKTP.CD.

Eionet Report - ETC/CME 2019/8 78
Annex 1 Effects of renewable energy on GHG emissions and energy consumption
The table below summarises the effect of deploying renewable energy since 2005 on GHG emissions and energy consumption by country in 2017, as discussed in
Sections 3.1-0 of this report.
Country
GHG emissions
(incl. international aviation)
Effect of renewables
Gross inland
consumption of fossil fuels
Effect of renewables
Primary energy
consumption
Effect of renewables
MtCO
2
e
MtCO
2
%
Mtoe
Mtoe
%
Mtoe
Mtoe
%
Austria
84.5
-12.1
-12
23.2
-4.2
-15
32.5
-0.6
-2
Belgium
119.4
-9.6
-7
40.4
-3.7
-8
49.1
-0.3
-1
Bulgaria
62.1
-6.3
-9
13.4
-1.7
-11
18.3
-0.6
-3
Croatia
25.5
-2.1
-8
6.4
-0.5
-8
8.3
-0.3
-3
Cyprus
10.0
-0.6
-6
2.4
-0.2
-7
2.5
-0.1
-2
Czech Republic
130.5
-10.9
-8
32.7
-3.1
-9
40.4
-0.3
-1
Denmark
50.8
-17.7
-26
11.4
-5.8
-34
17.7
-1.9
-10
Estonia
21.1
-1.5
-7
0.6
-0.5
-44
5.6
-0.1
-1
Germany
936.0
-142.4
-13
259.8
-38.5
-13
298.3
-12.5
-4
Greece
98.9
-7.8
-7
20.8
-2.4
-10
23.1
-1.3
-5
Finland
57.5
-14.6
-20
13.4
-4.3
-24
31.9
-0.4
-1
France
482.0
-37.3
-7
127.5
-13.0
-9
239.5
-3.4
-1
Hungary
64.5
-4.4
-6
18.4
-1.5
-8
24.5
+0.1
0
Ireland
63.8
-4.8
-7
12.6
-1.6
-11
14.4
-0.6
-4
Italy
439.0
-48.8
-10
126.3
-17.1
-12
148.9
-3.4
-2
Latvia
11.8
-1.2
-10
2.6
-0.2
-7
4.5
+0.3
+6
Lithuania
20.7
-2.6
-11
5.0
-0.5
-9
6.2
+0.3
+5
Luxembourg
11.9
-0.9
-7
3.5
-0.3
-7
4.3
-0.1
-1
Malta
2.6
-0.1
-5
0.7
-0.1
-7
0.8
0.0
-3
Netherlands
205.8
-9.0
-4
72.1
-3.1
-4
64.5
-0.7
-1
Poland
416.3
-24.1
-5
95.1
-6.3
-6
99.1
-1.2
-1
Portugal
74.6
-8.4
-10
19.2
-2.4
-11
22.8
-1.4
-6
Romania
114.8
-11.0
-9
24.6
-3.1
-11
32.4
-1.3
-4
Slovakia
43.5
-2.4
-5
11.2
-0.9
-7
16.1
0.0
0
Slovenia
17.5
-1.4
-7
4.2
-0.5
-11
6.6
-0.1
-2
Spain
357.3
-40.3
-10
97.9
-12.5
-11
125.6
-4.6
-4
Sweden
55.5
-29.7
-35
13.9
-9.3
-40
46.5
-3.4
-7
United Kingdom
505.4
-50.4
-9
149.6
-18.6
-11
176.8
-2.9
-2
EU-28
4 483
-502
-10
1 209
-156
-11
1 562
-41
-3
Eionet Report - ETC/CME 2019/8 79
Notes: This table shows the estimated effect of the increase in renewable energy consumption since 2005 on GHG emissions (total emissions, including international aviation and excluding LULUCF),
gross inland consumption of fossil fuels and primary energy consumption.
Source: EEA; (Eurostat 2019a; 2019d).

Eionet Report - ETC/CME 2019/8 80
Annex 2 Effects of renewable energy on air pollutant emissions
The table below summarises the absolute effect (in kt) of deploying renewable energy since 2005 on air pollutant emissions and the national total emission (in kt)
by pollutant and by country in 2017, as discussed in Section 3.4 of this report.
NO
x
PM
10
PM
2.5
SO
2
VOCs
RES All
RES
E
RES
H&C
Nation
al
Total
RES All
RES
E
RES
H&C
Nation
al
Total
RES All
RES
E
RES
H&C
Nation
al
Total
RES All
RES
E
RES
H&C
Nation
al
Total
RES All
RES
E
RES
H&C
Nation
al
Total
AT
-1,1
-0,9
-0,2
145
3,1
0,1
3,0
28
3,0
0,1
3,0
16
-1,1
-0,6
-0,5
13
12,5
0,3
12,2
120
BE
-1,0
-1,4
0,4
176
13,4
0,1
13,3
33
12,9
0,1
12,8
23
-0,1
0,1
-0,2
38
18,2
-0,2
18,4
109
BG
-0,7
-0,6
-0,1
103
1,4
-0,1
1,5
47
1,6
-0,1
1,7
32
-11,3
-2,1
-9,2
103
5,2
0,2
5,1
77
CY
-0,2
-0,1
-0,1
15
0,1
0,0
0,1
2
0,1
0,0
0,1
1
-0,4
-0,3
-0,1
16
0,3
0,1
0,3
12
CZ
0,9
-0,6
1,5
163
2,1
0,0
2,1
51
2,2
0,0
2,2
40
-6,6
-2,7
-3,9
110
8,8
2,7
6,1
207
DE
-7,4
-18,6
11,2
1188
5,2
-0,8
6,0
206
5,2
-0,8
5,9
99
-23,8
-19,6
-4,2
315
15,3
0,4
14,9
1069
DK
1,0
-1,2
2,2
112
13,9
0,0
14,0
31
13,6
0,0
13,6
20
0,6
-0,1
0,7
10
13,9
0,0
13,9
102
EE
-0,2
-0,1
0,0
33
4,1
-0,2
4,3
14
4,1
-0,1
4,2
9
-1,1
-0,9
-0,2
39
6,3
0,0
6,3
22
EL
-6,0
-5,6
-0,4
250
-1,2
-0,5
-0,6
57
-1,0
-0,4
-0,6
26
-4,7
-5,0
0,3
106
-1,4
-0,1
-1,3
148
ES
-10,1
-9,6
-0,4
739
2,8
-0,2
2,9
172
2,8
-0,1
2,9
105
-12,2
-10,3
-1,9
220
5,5
-0,1
5,6
618
FI
1,7
-1,4
3,1
130
10,6
-0,1
10,7
29
10,5
0,0
10,5
18
-7,0
-1,4
-5,5
35
18,1
0,3
17,8
88
FR
-9,5
-5,6
-4,0
807
10,6
-0,1
10,7
254
10,4
0,0
10,4
164
-2,1
-4,3
2,2
144
19,6
1,5
18,1
612
HR
-0,6
-0,5
-0,1
55
-0,6
0,0
-0,6
25
-0,6
0,0
-0,6
17
-0,5
-0,6
0,0
13
-1,0
0,1
-1,0
63
HU
1,2
-0,2
1,4
119
12,5
0,0
12,5
69
12,0
0,0
12,0
48
-1,9
-0,2
-1,7
28
23,2
0,1
23,1
142
IE
-1,6
-1,6
0,0
110
0,0
-0,2
0,1
27
0,0
-0,1
0,1
12
-2,0
-1,4
-0,6
13
1,0
0,0
1,0
113
IT
12,7
4,1
8,5
709
35,8
0,0
35,8
196
34,8
0,1
34,7
165
2,2
-2,0
4,1
115
66,2
5,4
60,8
935
LT
0,5
-0,1
0,6
53
3,5
0,0
3,5
14
3,5
0,0
3,5
9
-7,1
0,1
-7,2
13
7,0
0,1
6,8
46
LU
0,0
0,0
0,0
18
0,3
0,0
0,3
2
0,3
0,0
0,3
1
0,1
0,0
0,1
1
0,6
0,1
0,6
12
LV
0,5
0,1
0,3
37
2,5
0,0
2,5
25
2,5
0,0
2,4
18
0,0
0,0
0,0
4
3,0
0,4
2,5
38
MT
-0,1
-0,1
0,0
5
0,0
0,0
0,0
0
0,0
0,0
0,0
0
0,0
-0,1
0,0
0
0,0
0,0
0,0
3
NL
-0,2
-1,2
1,0
252
2,7
0,0
2,8
27
2,7
0,0
2,7
14
0,9
-0,3
1,2
27
6,3
0,6
5,6
252
PL
-3,1
-4,0
0,9
804
4,0
-0,1
4,2
246
4,2
-0,1
4,3
147
-33,9
-6,9
-27,0
583
33,8
1,0
32,8
691
PT
-4,3
-3,1
-1,2
159
-7,0
0,0
-7,0
73
-6,8
0,0
-6,8
51
-0,1
-0,8
0,7
48
-11,5
0,2
-11,7
168
RO
-2,2
-2,7
0,5
232
3,7
-0,4
4,1
143
3,6
-0,3
4,0
112
-8,8
-8,7
-0,1
107
5,0
-0,1
5,1
240
SE
-3,7
-2,5
-1,2
124
5,3
0,1
5,2
40
5,2
0,1
5,1
20
-4,3
-2,0
-2,3
18
9,6
0,0
9,7
147
SI
-0,1
-0,2
0,1
35
2,8
0,0
2,8
13
2,7
0,0
2,8
11
-0,2
-0,2
0,0
5
4,0
0,1
3,8
30
SK
0,5
0,1
0,3
66
3,6
0,0
3,6
23
3,5
0,0
3,5
18
0,3
-0,1
0,4
27
3,9
0,7
3,2
89
UK
-12,7
-19,0
6,4
893
13,3
1,6
11,6
171
12,5
1,5
11,0
107
-33,3
-19,4
-13,9
173
22,2
0,8
21,4
809
EU-
28
-45,8
-76,5
30,8
7532
148,5
-0,8
149,3
2019
145,4
-0,3
145,7
1304
-158,7
-89,8
-68,9
2323
295,6
14,3
281,3
6964

Eionet Report - ETC/CME 2019/8 81
The table below summarises the relative effect of deploying renewable energy since 2005 on total air pollutant emissions frozen at 2005 level (%) and the
national total emissions (in kt) by pollutant and by country in 2017, as discussed in Section 3.4 of this report.
NO
x
PM
10
PM
2.5
SO
2
VOCs
RES All
RES
E
RES
H&C
Nation
al
Total
RES All
RES
E
RES
H&C
Nation
al
Total
RES All
RES
E
RES
H&C
Nation
al
Total
RES All
RES
E
RES
H&C
Nation
al
Total
RES All
RES
E
RES
H&C
Nation
al
Total
AT
-0,8%
-0,6%
-0,1%
145
12,5%
0,3%
10,3%
28
23,8%
0,6%
18,0%
16
-7,9%
-4,3%
-3,6%
13
11,6%
0,3%
11,3%
120
BE
-0,6%
-0,8%
0,2%
176
67,0%
0,3%
38,7%
33
126,7
%
0,4%
53,2%
23
-0,3%
0,3%
-0,5%
38
20,0%
-0,2%
20,3%
109
BG
-0,7%
-0,6%
-0,1%
103
3,1%
-0,2%
3,1%
47
5,3%
-0,3%
5,2%
32
-9,9%
-2,0%
-8,0%
103
7,2%
0,3%
7,1%
77
CY
-1,4%
-0,7%
-0,7%
15
5,1%
0,0%
4,4%
2
8,5%
0,0%
6,8%
1
-2,4%
-1,8%
-0,6%
16
2,5%
0,8%
2,5%
12
CZ
0,6%
-0,4%
0,9%
163
4,3%
0,0%
4,2%
51
5,8%
0,0%
5,6%
40
-5,7%
-2,5%
-3,3%
110
4,4%
1,3%
3,0%
207
DE
-0,6%
-1,6%
0,9%
1188
2,6%
-0,4%
2,8%
206
5,5%
-0,8%
5,5%
99
-7,0%
-6,1%
-1,2%
315
1,5%
0,0%
1,4%
1069
DK
0,9%
-1,1%
2,0%
112
81,0%
0,0%
46,6%
31
210,5
%
0,0%
71,4%
20
6,2%
-1,1%
7,3%
10
15,7%
0,0%
15,7%
102
EE
-0,6%
-0,3%
0,0%
33
41,8%
-1,4%
30,5%
14
80,1%
-1,1%
44,6%
9
-2,8%
-2,3%
-0,5%
39
39,5%
0,0%
39,5%
22
EL
-2,3%
-2,2%
-0,2%
250
-2,1%
-0,8%
-1,0%
57
-3,7%
-1,3%
-1,9%
26
-4,3%
-4,5%
0,3%
106
-0,9%
-0,1%
-0,9%
148
ES
-1,3%
-1,3%
-0,1%
739
1,7%
-0,1%
1,6%
172
2,7%
-0,1%
2,5%
105
-5,2%
-4,5%
-0,8%
220
0,9%
0,0%
0,9%
618
FI
1,3%
-1,1%
2,4%
130
57,1%
-0,4%
39,0%
29
144,0
%
0,0%
65,3%
18
-16,7%
-4,2%
-13,1%
35
25,8%
0,3%
25,2%
88
FR
-1,2%
-0,7%
-0,5%
807
4,4%
0,0%
4,1%
254
6,7%
0,0%
6,0%
164
-1,4%
-2,8%
1,5%
144
3,3%
0,2%
3,0%
612
HR
-1,1%
-0,9%
-0,2%
55
-2,3%
0,0%
-2,3%
25
-3,5%
0,0%
-3,5%
17
-3,8%
-4,6%
0,0%
13
-1,6%
0,2%
-1,6%
63
HU
1,0%
-0,2%
1,2%
119
22,2%
0,0%
18,5%
69
33,4%
0,0%
25,7%
48
-6,4%
-0,8%
-5,7%
28
19,6%
0,1%
19,5%
142
IE
-1,4%
-1,4%
0,0%
110
0,0%
-0,7%
0,3%
27
0,0%
-0,7%
0,7%
12
-13,1%
-9,4%
-3,9%
13
0,9%
0,0%
0,9%
113
IT
1,8%
0,6%
1,2%
709
22,4%
0,0%
19,6%
196
26,8%
0,1%
22,8%
165
1,9%
-2,0%
3,6%
115
7,6%
0,6%
7,0%
935
LT
0,9%
-0,2%
1,1%
53
32,7%
0,0%
25,6%
14
62,7%
0,0%
40,8%
9
-35,0%
0,8%
-35,5%
13
18,1%
0,2%
17,5%
46
LU
0,0%
0,0%
0,0%
18
17,6%
0,0%
15,0%
2
28,8%
0,0%
22,4%
1
11,0%
0,0%
11,0%
1
5,2%
0,8%
5,2%
12
LV
1,4%
0,3%
0,8%
37
11,1%
0,0%
10,2%
25
16,2%
0,0%
13,7%
18
0,0%
0,0%
0,0%
4
8,5%
1,1%
7,0%
38
MT
-1,8%
-1,8%
0,0%
5
0,0%
0,0%
0,0%
0
0,0%
0,0%
0,0%
0
0,0%
-40,0%
0,0%
0
0,0%
0,0%
0,0%
3
NL
-0,1%
-0,5%
0,4%
252
11,1%
0,0%
10,3%
27
23,9%
0,0%
19,0%
14
3,5%
-1,1%
4,6%
27
2,6%
0,2%
2,3%
252
PL
-0,4%
-0,5%
0,1%
804
1,7%
0,0%
1,7%
246
2,9%
-0,1%
2,9%
147
-5,5%
-1,2%
-4,4%
583
5,1%
0,1%
5,0%
691
PT
-2,6%
-1,9%
-0,7%
159
-8,8%
0,0%
-9,1%
73
-11,7%
0,0%
-12,2%
51
-0,2%
-1,5%
1,5%
48
-6,4%
0,1%
-6,5%
168
RO
-0,9%
-1,2%
0,2%
232
2,7%
-0,3%
2,8%
143
3,3%
-0,3%
3,5%
112
-7,6%
-8,0%
-0,1%
107
2,1%
0,0%
2,2%
240
SE
-2,9%
-2,0%
-0,9%
124
15,1%
0,2%
11,8%
40
34,9%
0,4%
21,4%
20
-19,7%
-9,4%
-10,5%
18
7,0%
0,0%
7,1%
147
SI
-0,3%
-0,6%
0,3%
35
27,5%
0,0%
21,4%
13
30,8%
0,0%
24,2%
11
-3,9%
-4,0%
0,0%
5
15,5%
0,3%
14,6%
30
SK
0,8%
0,2%
0,5%
66
19,0%
0,0%
16,3%
23
24,0%
0,0%
19,9%
18
1,1%
-0,4%
1,5%
27
4,6%
0,8%
3,7%
89
UK
-1,4%
-2,1%
0,7%
893
8,4%
0,9%
6,3%
171
13,3%
1,3%
9,2%
107
-16,2%
-10,5%
-6,7%
173
2,8%
0,1%
2,7%
809
EU-28
-0,6%
-1,0%
0,4%
7532
7,9%
0,0%
7,2%
2019
12,5%
0,0%
10,8%
1304
-6,4%
-3,8%
-2,8%
2323
4,4%
0,2%
4,2%
6964
Eionet Report - ETC/CME 2019/8 82
Annex 3 Methodology and data sources for calculating approximated RES
shares
The general methodology to calculate the approximated RES shares is laid out in the EEA report Renewable
energy in Europe — Approximated recent growth and knock-on effects (EEA 2015). The data have been
updated to reflect the most up-to-date values available at the end of July 2019, when no officially reported
RES data for 2018 were available.
Some improvements in the methodology were made for the estimation of 2016 RES shares:
• The calculation is made in Eurostat’s Short Assessment of Renewable Energy Sources (SHARES) tool.
This improves consistency with the methodology laid out in the RED and RES shares data published by
Eurostat.
• An exponential trend extrapolation, instead of a linear extrapolation, is used as the standard fall-back
option.
The following list documents the data sources used in the RES proxy calculation:
• Eurostat :
o supply and generation of electricity [Eurostat early estimate]:
▪ consumption of electricity;
▪ total gross production;
▪ electricity imports and exports;
▪ gross production from hydro- and pumped storage.
▪ distribution losses
• EurObserv’ER:
o Photovoltaic barometer 2019:
▪ electricity production from solar PV power.
o Wind energy barometer 2019:
▪ electricity production from wind energy.
• Member State data (not included by default, but received during Eionet consultation):
o Latvia submitted detailed energy consumption data, which replaced the EEA’s proxy
calculation.
o Germany submitted basic energy consumption data, which improved the EEA’s proxy
calculation.
o Ireland submitted detailed and complete RES shares data for 2018, which replaced the EEA’s
proxy calculation.
o Lithuania submitted basic energy consumption data, which improved the EEA’s proxy
calculation.
o Luxembourg submitted partially complete RES shares data, which improved the EEA’s proxy
calculation.
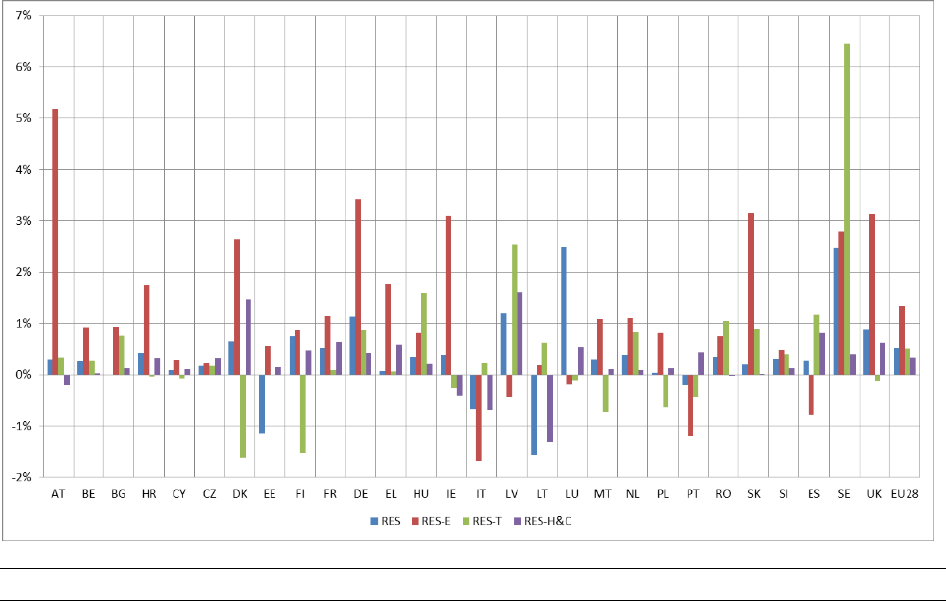
ETC/ACM Technical Paper 2014/7 March 2015
Eionet Report - ETC/CME 2019/8 83
Annex 4 Discussion of main 2017/2018 changes by sector and country
Changes in calculated RES shares proxies for the years 2017/2018 are compared with historically (2005-
2017) observed changes in RES shares by way of descriptive statistics to determine statistically significant
deviations from the historical changes.
If, in 2017/2018, changes in RES shares were significantly different but within the historically observed
minima and maxima, the results were considered plausible without further analysis. If the 2017/2018
changes in RES shares were higher or lower than historically observed changes, further in-depth analysis
was performed. The reasons for these strong decreases or increases were found and are described below.
Figure 39 shows the changes between approximated 2018 RES shares and 2017 RES shares, while Table
16 provides detailed insights.
Figure 39 Changes in approximated RES shares in 2018 compared with 2017 in percentage points
Source: EEA.

ETC/ACM Technical Paper 2014/7 March 2015
Eionet Report - ETC/CME 2019/8 84
RES
RES-E
RES-T
RES-H&C
2017
2018
Change
2017
2018
Change
2017
2018
Delta
2017
2018
Change
Austria
32.6
32.9
0.3
72.2
77.3
5.2
9.7
10.1
0.3
32.0
31.9
-0.2
Belgium
9.0
9.3
0.3
17.2
18.2
0.9
6.6
6.8
0.3
8.0
8.1
0.0
Bulgaria
18.7
18.7
0.0
19.1
20.0
0.9
7.2
8.0
0.8
29.9
30.0
0.1
Croatia
27.3
27.7
0.4
46.4
48.2
1.7
1.2
1.1
0.0
36.5
36.9
0.3
Cyprus
9.9
9.9
0.1
8.9
9.2
0.3
2.6
2.5
-0.1
24.5
24.6
0.1
Czech Republic
14.8
14.9
0.2
13.7
13.9
0.2
6.6
6.8
0.2
19.7
20.0
0.3
Denmark
35.8
36.4
0.6
60.4
63.0
2.6
6.8
5.2
-1.6
46.5
48.0
1.5
Estonia
29.2
28.1
-1.1
17.0
17.6
0.6
0.4
0.4
0.0
51.6
51.8
0.1
Finland
41.0
41.7
0.7
35.2
36.1
0.9
18.8
17.3
-1.5
54.8
55.3
0.5
France
16.3
16.8
0.5
19.9
21.0
1.1
9.1
9.2
0.1
21.3
22.0
0.6
Germany
15.5
16.6
1.1
34.4
37.8
3.4
7.0
7.9
0.9
13.4
13.9
0.4
Greece
17.0
17.0
0.1
24.5
26.2
1.8
4.0
4.1
0.1
26.6
27.2
0.6
Hungary
13.3
13.7
0.4
7.5
8.3
0.8
6.8
8.4
1.6
19.6
19.8
0.2
Ireland
10.7
11.0
0.4
30.1
33.2
3.1
7.4
7.2
-0.3
6.9
6.5
-0.4
Italy
18.3
17.6
-0.7
34.1
32.4
-1.7
6.5
6.7
0.2
20.1
19.4
-0.7
Latvia
39.0
40.2
1.2
54.4
53.9
-0.4
2.5
5.1
2.5
54.6
56.2
1.6
Lithuania
25.8
24.3
-1.6
18.3
18.4
0.2
3.7
4.3
0.6
46.5
45.2
-1.3
Luxembourg
6.4
8.9
2.5
8.1
7.9
-0.2
6.4
6.3
-0.1
8.1
8.6
0.5
Malta
7.2
7.5
0.3
6.6
7.7
1.1
6.8
6.1
-0.7
19.8
19.9
0.1
Netherlands
6.6
7.0
0.4
13.8
14.9
1.1
5.9
6.8
0.8
5.9
6.0
0.1
Poland
10.9
10.9
0.0
13.1
13.9
0.8
4.2
3.6
-0.6
14.5
14.6
0.1
Portugal
28.1
27.9
-0.2
54.2
53.0
-1.2
7.9
7.5
-0.4
34.4
34.8
0.4
Romania
24.5
24.8
0.3
41.6
42.4
0.7
6.6
7.6
1.0
26.6
26.6
0.0
Slovakia
11.5
11.7
0.2
21.3
24.5
3.1
7.0
7.9
0.9
9.8
9.8
0.0
Slovenia
21.6
21.9
0.3
32.4
32.9
0.5
2.7
3.1
0.4
33.2
33.4
0.1
Spain
17.5
17.8
0.3
36.3
35.6
-0.8
5.9
7.1
1.2
17.5
18.3
0.8
Sweden
54.5
57.0
2.5
65.9
68.7
2.8
38.6
45.1
6.5
69.1
69.5
0.4
United Kingdom
10.2
11.1
0.9
28.1
31.2
3.1
5.1
4.9
-0.1
7.5
8.1
0.6
European Union
17.5
18.0
0.5
30.7
32.1
1.4
7.6
8.1
0.5
19.5
19.8
0.3
Table 16 Shares of renewable energy (%) in 2017 and 2018
Sources: EEA; (Eurostat 2019d).
Renewable electricity
The change in the RES-E shares proxy for 2018 compared with 2017 (+1.4 %) for the whole EU is smaller
by 0.1 standard deviations than the average annual change in RES-E shares in the period from 2005 to
2017 (+1.3 %).
The calculated changes in the RES-E shares proxies 18 Member States are within 1 standard deviation of
the average changes for the period 2005-2017. In 10 Member States, the 2017/2018 change is significantly
different from the 2005-2017 average at the 5 % level (Austria, France, Germany, Ireland, Italy, Lithuania,
Luxembourg, Portugal, Slovakia and Spain.), as shown in Figure 40. Of those, six Member States showed
changes in RES-E shares that were larger than the historically observed average ±1 standard deviation.
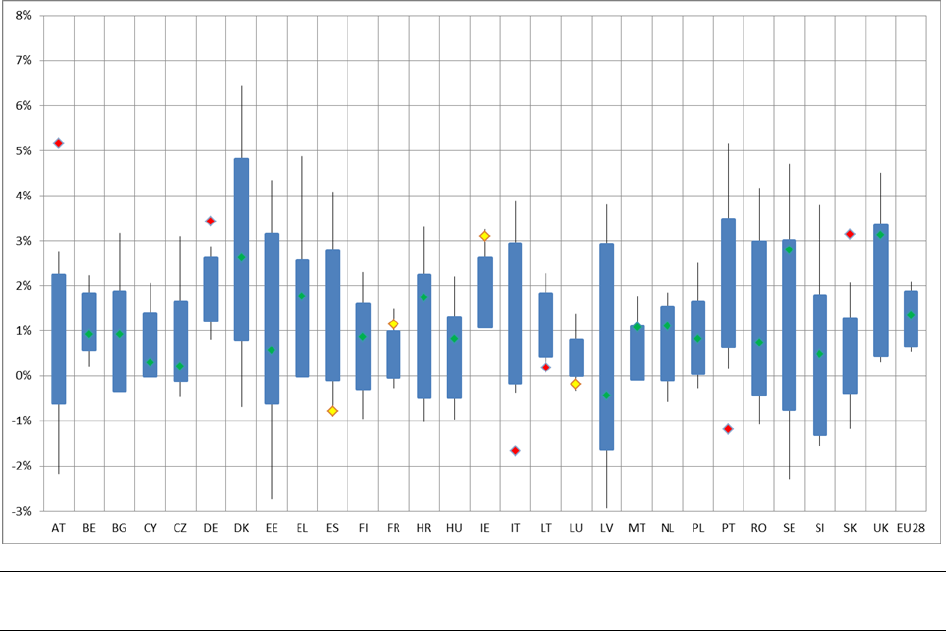
ETC/ACM Technical Paper 2014/7 March 2015
Eionet Report - ETC/CME 2019/8 85
Figure 40 Changes in RES-E shares between 2017 and 2018 compared with historically observed annual
changes in RES-E shares (2005-2017) in percentage points
Notes: Blue bars show the range of average annual changes in RES-E shares between 2005 and 2017, plus or minus one standard
deviation. Thin lines represent minimum and maximum year-to-year changes in this period. Diamonds show the change in proxy
RES share for 2018 compared with 2017. Green: change between 2017 and 2018 within 1 standard deviation of changes from
2005 to 2017. Yellow: change between 2017 and 2018 within minimum and maximum change from 2005 to 2017. Red: change
between 2017 and 2018 larger than changes from 2005 to 2017.
Source: EEA.
The following six Member States show larger changes in RES-E shares than have been historically observed.
Austria: The absolute contribution of RES-E generation increased (+3 %), and at the same time electricity
consumption decreased (-4 %) leading to a significantly increasing RES-E share (from 72.2 % in 2017 to
77.3 % in 2018).
Germany: Strong increases in wind (+12 %) and solar (16 %) led to a total increase in RES-E generation of
9 %, while electricity consumption fell by 1 %. The RES-E share increased from 34.4 % in 2017 to 37.8 % in
2018.
Italy: Decreases in solar (-10 %) and other renewables (-20 %) led to a total decrease in RES-E generation
by -5 %.Combined with a constant electricity consumption this led to a decreasing RES-E share (from
34.1 % in 2017 to 32.4 % in 2018).
Lithuania: The absolute contribution of RES-E generation grew slightly more (+4 %) than electricity
consumption (+3 %). As a result, the RES-E share increased from 18.3 % in 2017 to 18.4 % in 2018.
Portugal: The absolute contribution of RES-E generation decreased (-2 %) and electricity consumption
grew (+2 %), leading to a decreasing RES-E share (from 54.2 % in 2017 to 53.0 % in 2018).
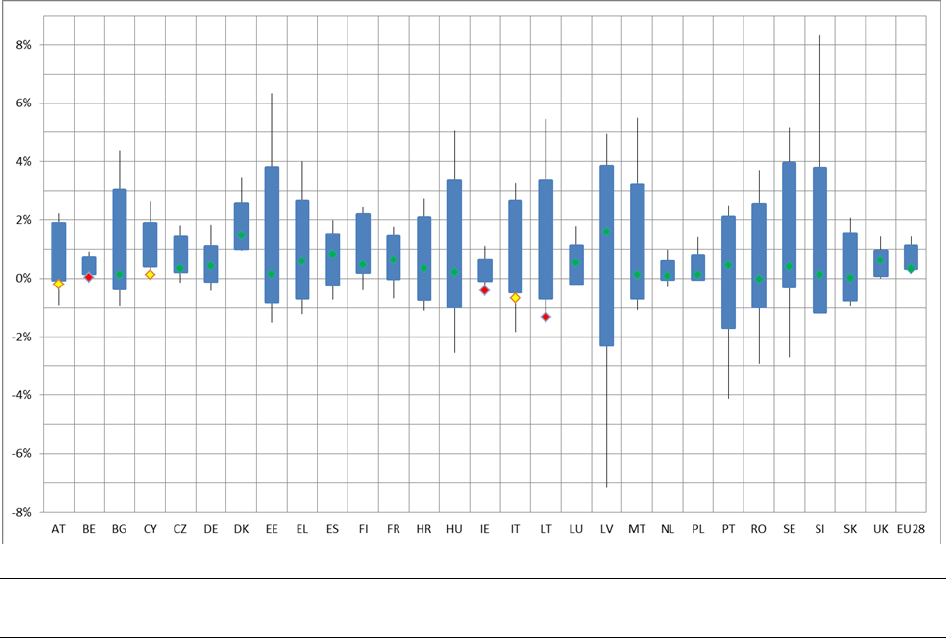
ETC/ACM Technical Paper 2014/7 March 2015
Eionet Report - ETC/CME 2019/8 86
Slovakia: Total RES-E generation stayed constant, but a -13 % decrease in electricity consumption led to a
significantly increasing RES-E share (from 21.3 % in 2017 to 24.5 % in 2018).
Renewable heating and cooling
The change in the RES-H&C shares proxy for 2018 compared with 2017 (+0.3 %) for the whole EU is smaller
by 1. standard deviations than the average annual change in RES-H&C shares in the period from 2005 to
2017 (+0.7%). This deviation is significant at the 5 % level (p = 0.002).
The calculated changes in the RES-H&C shares proxies for 22 Member States are within 1 standard
deviation of the average changes for the period 2005-2017. In six Member States, the 2017/2018 change
is significantly different from the 2005-2017 average at the 5 % level (Austria, Cyprus, Italy, Belgium,
Ireland and Lithuania ), as shown in Figure 41. Of those, three Member States showed changes in RES-H&C
shares that are larger than the historically observed average ±1 standard deviation.
Figure 41 Change in RES-H&C shares between 2017 and 2018 compared with historically observed
annual changes in RES-H&C shares (2005-2017) in percentage points
Notes: Blue bars show the range of average annual changes in RES-H&C shares between 2005 and 2017, plus or minus one
standard deviation. Thin lines represent minimum and maximum year-to-year changes in this period. Diamonds show the change
in proxy RES share for 2018 compared with 2017. Green: change between 2017 and 2018 within 1 standard deviation of changes
from 2005 to 2017. Yellow: change between 2017 and 2018 within minimum and maximum change from 2005 to 2017. Red:
change between 2017 and 2018 larger than changes from 2005 to 2017.
Source: EEA.
The following three Member States show larger changes in RES-H&C shares than have been historically
observed. The changes detailed below may be calculation artefacts due to the lack of timely data available
on bioenergy consumption in heating and cooling.
Belgium: Heat pumps increased strongly (+9 %), but it is estimated that the energy consumption for
heating and cooling and RES-H&C stayed constant in 2018.The RES-H&C share stayed 8.0 % in 2018 too.
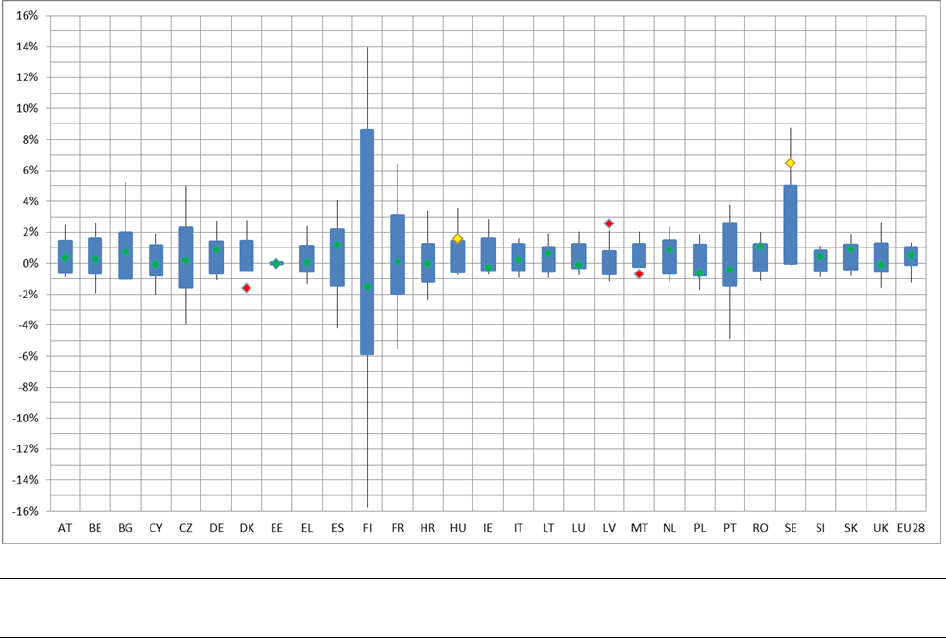
ETC/ACM Technical Paper 2014/7 March 2015
Eionet Report - ETC/CME 2019/8 87
Ireland: It is estimated that the energy consumption for heating and cooling increased by 6 % in 2018,
while RES-H&C decreased by 1 %.This led to a decrease in the RES-H&C share from 6.9 % in 2017 to 6.5 %
in 2018.
Lithuania: Renewable energy consumption in the heating and cooling sector is expected to decrease
slightly by 2 % and total energy consumption for heating and cooling is estimated to increase by 1 %. This
would lead to a decrease in the RES-H&C share from 46.5 % in 2017 to 45.2 % in 2018.
Renewable transport fuels
At the EU level, the RES-T shares proxy for 2018 increased only slightly compared with 2017 (+0.5 %). This
small increase is lower by 0.05 standard deviations than the average annual change in RES-T shares over
the period from 2005 to 2017 (+0.5 %), and it is only at the threshold of being significantly different at the
5 % level (p = 0.05) because the change between 2010 and 2011 (-1.3 %) showed a decrease in the RES-T
share.
The calculated changes in the RES-T shares proxies for 23 Member States are within one standard deviation
of the average changes for the period 2005-2017. In seven Member States, the change between 2017 and
2018 was significantly different from the 2005-2017 average at the 5 % level (Hungary, Sweden, Denmark,
Luxembourg and Lithuania), as illustrated in Figure 42. Of those, three Member States showed changes in
RES-T shares that are larger than the historically observed average ±1 standard deviation.
Figure 42 Changes in RES-T shares between 2016 and 2017, compared with historically observed annual
changes in RES-T shares (2005 -2016) in percentage points
Notes: Blue bars show the range of average annual changes in RES-T shares between 2005 and 2017, plus or minus one standard
deviation. Thin lines represent minimum and maximum year-to-year changes in this period. Diamonds show the change in proxy
RES share for 2018 compared with 2017. Green: change between 2017 and 2018 within 1 standard deviation of changes from
2005 to 2017. Yellow: change between 2017 and 2018 within minimum and maximum change from 2005 to 2017. Red: change
between 2017 and 2018 larger than changes from 2005 to 2017. Source: EEA.
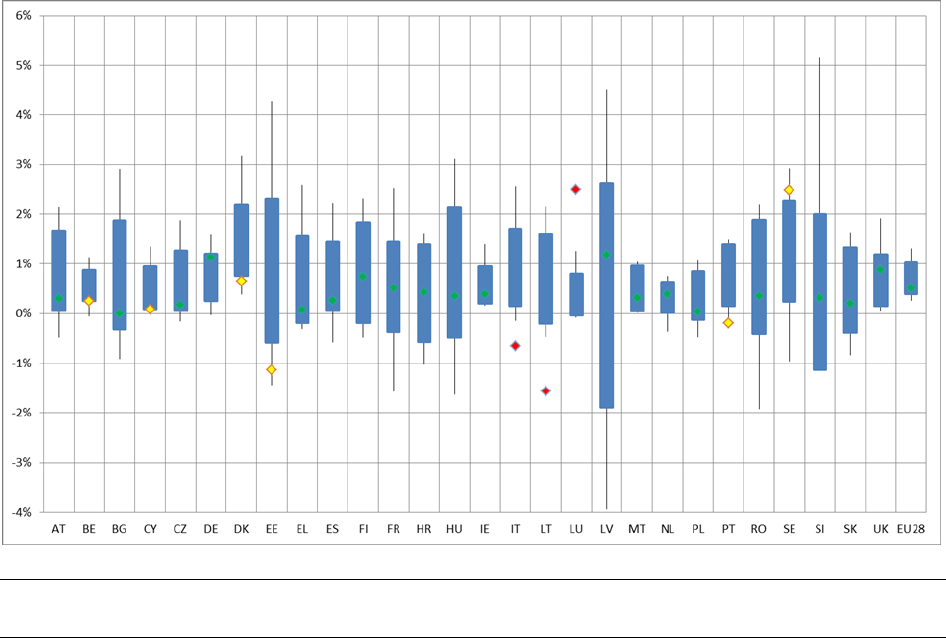
ETC/ACM Technical Paper 2014/7 March 2015
Eionet Report - ETC/CME 2019/8 88
The following three Member States show larger changes in RES-T shares than have been historically
observed.
Denmark: Consumption of (certified) biofuels decreased by 28 % leading to a 23 % reduction in the RES-T
numerator. Combined with an increasing RES-T denominator (+1 %), this led to a decrease in the RES-T
share from 6.9 % in 2017 to 5.2 % in 2018.
Luxembourg: Consumption of biofuels grew by 4 %, but at the same time, consumption of all fuels grew
by 6 %. As a result, the RES-T share decreased from 6.4 % in 2017 to 6.3 % in 2018.
Lithuania: Consumption of compliant biofuels grew significantly by 28 % and consumption of all fuels grew
7 %. As a result, the RES-T share increased from 3.7 % in 2017 to 4.3% in 2018.
Total renewable energy sources
The change in the RES shares proxy for 2018 compared with 2017 (+0.5 %) for the whole EU was lower
than the observed average annual change in RES shares in the period from 2005 to 2017 (+0.6 %). This is
significantly different at the 5 % level (p = 0.002).
Figure 43 Change in RES shares between 2017 and 2018, compared with historically observed annual
changes in RES shares (2005-2017) in percentage points
Notes: Blue bars show the range of average annual changes in RES shares between 2005 and 2017, plus or minus one standard
deviation. Thin lines represent minimum and maximum year-to-year changes in this period. Diamonds show the change in proxy
RES share for 2018 compared with 2017. Green: change between 2017 and 2018 within 1 standard deviation of changes from
2005 to 2017. Yellow: change between 2017 and 2018 within minimum and maximum change from 2005 to 2017. Red: change
between 2017 and 2018 larger than changes from 2005 to 2017.
Source: EEA.
The calculated changes in the RES shares proxies for 19 Member States are within one standard deviation
of the average changes in the period from 2005 to 2017. In nine Member States, the change between 2017
ETC/ACM Technical Paper 2014/7 March 2015
Eionet Report - ETC/CME 2019/8 89
and 2018 was significantly different from the 2005-2017 average at the 5 % level (Belgium, Cyprus,
Denmark, Estonia, Portugal, Sweden, Italy, Lithuania and Luxembourg). Of those, three Member States
showed changes in RES shares that are larger than the historically observed average ±1 standard deviation.
In Italy, electricity generated from all sources rose only slightly at the same time as electricity generated
from renewable sources decreased significantly. Hydro power and geothermal increased while solar power
decreased with all other renewables.
In Lithuania, all fuel consumed for heating and cooling increased, but share of renewables decreased at
the same time. Lithuania also had 47.3 ktoe of renewables deducted by statistical transfers to Luxembourg.
In Luxembourg, all fuel consumed for heating and cooling increased slightly, but share of renewables
increased significantly. Luxembourg also had 94.6 ktoe of renewables by statistical transfers from Lithuania
and Estonia.
In Bulgaria, Estonia, Italy, Lithuania and Portugal, RES shares even decreased. In Germany and Latvia, RES
shares increased more than 1 %, and in Sweden and Luxembourg, increase was more than 2 %.
However, it should be stressed that the RES proxy calculations have a tendency to underestimate RES
shares. One reason is the lack of timely data available on bioenergy consumption in heating and cooling.
Proxy 2017 versus RES shares 2017
Table 17 provides insights into the difference between approximated 2017 RES shares (calculated in 2018)
and actual 2017 RES shares (available for the first time in 2019). For some countries, these differences can
be larger, especially when looking at the amount of RES-T. These differences can stem from different
methodologies used by countries following the adoption of the ILUC Directive (EU, 2015a), as well as from
the difficulty of replicating the specific accounting rules in the RED concerning very specific shares of RES-
T (see also Section 1.2.2).

ETC/ACM Technical Paper 2014/7 March 2015
Eionet Report - ETC/CME 2019/8 90
RES
RES-E
RES-T
RES-H&C
Final
Proxy
Change
Final
Proxy
Change
Final
Proxy
Change
Final
Proxy
Change
Austria
32.6
33.7
1.2
72.2
72.0
-0.2
9.7
10.6
0.8
32.0
34.1
2.0
Belgium
9.1
9.4
0.3
17.2
17.8
0.6
6.6
6.0
-0.6
8.0
8.7
0.7
Bulgaria
18.7
18.7
0.0
19.1
18.8
-0.3
7.2
7.2
-0.1
29.9
30.2
0.3
Cyprus
9.9
9.1
-0.7
8.9
9.0
0.1
2.6
2.5
0.0
24.5
22.6
-1.9
Czech Republic
14.8
15.1
0.4
13.7
13.6
-0.1
6.6
6.3
-0.2
19.7
20.5
0.8
Germany
15.5
15.2
-0.3
34.4
34.6
0.2
7.0
7.0
-0.1
13.4
12.9
-0.6
Denmark
35.8
33.7
-2.1
60.4
59.5
-0.9
6.8
6.9
0.0
46.5
43.0
-3.6
Estonia
29.2
27.6
-1.6
17.0
16.8
-0.3
0.4
0.4
0.0
51.6
48.1
-3.5
Greece
17.0
15.5
-1.5
24.5
24.5
0.0
4.0
1.7
-2.3
26.6
24.5
-2.1
Spain
17.5
17.7
0.2
36.3
36.4
0.0
5.9
5.7
-0.2
17.5
17.8
0.3
Finland
41.0
39.9
-1.1
35.2
35.2
-0.1
18.8
8.4
-10.4
54.8
55.0
0.1
France
16.3
16.1
-0.2
19.9
19.9
0.0
9.1
8.7
-0.4
21.3
21.1
-0.3
Croatia
27.3
28.7
1.4
46.4
49.3
2.9
1.2
1.3
0.1
36.5
38.1
1.5
Hungary
13.3
13.4
0.1
7.5
7.2
-0.3
6.8
5.5
-1.3
19.6
20.0
0.4
Ireland
10.7
10.8
0.2
30.1
30.1
0.0
7.4
7.2
-0.2
6.9
7.5
0.6
Italy
18.3
17.8
-0.5
34.1
33.2
-0.9
6.5
7.4
0.9
20.1
19.7
-0.4
Lithuania
25.8
25.8
0.0
18.3
18.3
0.0
3.7
3.7
0.0
46.5
46.5
0.0
Luxembourg
6.4
5.7
-0.7
8.1
7.4
-0.7
6.4
6.2
-0.2
8.1
7.3
-0.8
Latvia
39.0
38.2
-0.8
54.4
53.9
-0.4
2.5
2.7
0.1
54.6
53.3
-1.3
Malta
7.2
7.0
-0.1
6.6
5.7
-0.9
6.8
6.7
-0.1
19.8
16.6
-3.2
Netherlands
6.6
6.5
-0.1
13.8
14.3
0.5
5.9
6.7
0.8
5.9
5.4
-0.5
Poland
10.9
11.2
0.3
13.1
14.2
1.1
4.2
4.5
0.3
14.5
14.4
-0.1
Portugal
28.1
28.5
0.4
54.2
52.7
-1.5
7.9
8.3
0.4
34.4
35.3
0.9
Romania
24.5
25.0
0.5
41.6
42.6
0.9
6.6
6.4
-0.2
26.6
27.3
0.7
Sweden
54.5
54.8
0.3
65.9
66.1
0.2
38.6
29.4
-9.3
69.1
70.0
1.0
Slovenia
21.5
21.0
-0.6
32.4
31.9
-0.5
2.7
1.5
-1.2
33.2
33.8
0.6
Slovakia
11.5
11.8
0.3
21.3
21.3
-0.1
7.0
6.7
-0.4
9.8
10.2
0.4
United Kingdom
10.2
9.9
-0.3
28.1
26.5
-1.6
5.1
4.7
-0.3
7.5
7.5
0.0
European Union
17.5
17.4
-0.2
30.7
30.6
-0.1
7.6
7.2
-0.4
19.5
19.3
-0.2
Table 17 2017 RES shares by sector compared with approximated RES shares by sector (all %)
Sources: EEA; (Eurostat 2019d).
At the EU level, approximated RES share was estimated to be 0.2 percentage points lower than the final
RES share published by Eurostat. Sectoral RES shares were underestimated in transport by 0.4 percentage
points, RES-E by 0.1 percentage points and for heating and cooling by 0.2 percentage points.
Deviations in RES shares are less than 2.2 percentage point for all Member States, and deviations are larger
than 1 percentage point in six Member States. At sectoral level, deviations are larger than 1 percentage
point in four Member States for RES-E shares, in five Member States for RES-T shares and in eight Member
States for RES-H&C shares. Short-term proxy estimates are most difficult in the heating and cooling sector.
This is mainly the result of two effects: (1) on the one hand, bioenergy is the predominant renewable
energy source in this sector but useful data sources are unavailable there; (2) on the other hand, gross
final energy consumption in the heating and cooling sector is hard to estimate due to the strong influence
of climatic conditions.
For some Member States, the deviation between proxy and final data for 2017 is considerable. The largest
deviations occurred for Finland and Sweden in the transport sector. For Finland, the full extent of recovery
ETC/ACM Technical Paper 2014/7 March 2015
Eionet Report - ETC/CME 2019/8 91
from the 68 % drop in certified biofuels in Eurostat SHARES from 2015 to 2016 was not present in the data
source used for calculation, leading to a strong underestimate of the RES-T share by 10.4 percentage
points. In the case of Sweden, the underestimate of 9.3 percentage points is also due to different
accounting rules: while all certified biofuels increased in final SHARES data by 13 %, Annex IX biofuels,
which are double counted, increased by 26 %. The RES proxy calculation does not differentiate between
them, and therefore the same change as for all certified biofuels, was applied to Annex IX biofuels.
In general, the approximated 2017 RES proxy shares underestimated rather than overestimated actual RES
shares in 2017.

European Topic Centre on Climate change
mitigation and energy
Boeretang 200
B-2400 Mol, Belgium
Tel.: +32 14 33 59 77
Web: www.vito.be
Email: [email protected]
The European Topic Centre on Climate change
mitigation and energy (ETC/CME) is a consortium of
European institutes under contract of the European
Environment Agency.
